Figure 3.

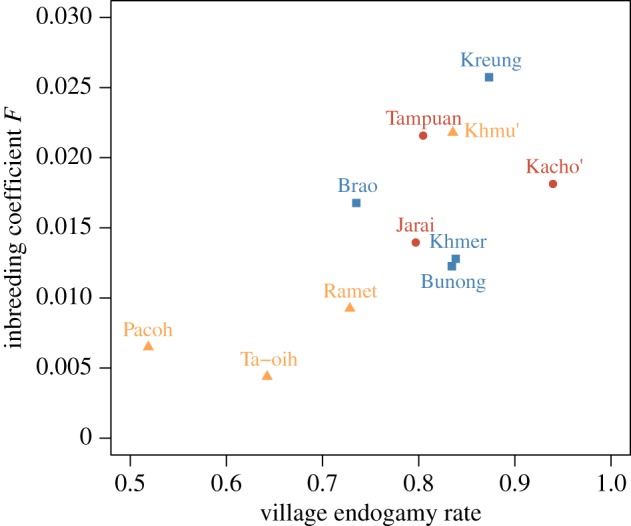
Relationship between village endogamy rate and mean genetic inbreeding coefficient by population. M populations are in red (circles), C populations in blue (squares) and P populations in yellow (triangles). (Online version in colour.)

Relationship between village endogamy rate and mean genetic inbreeding coefficient by population. M populations are in red (circles), C populations in blue (squares) and P populations in yellow (triangles). (Online version in colour.)