Figure 8.
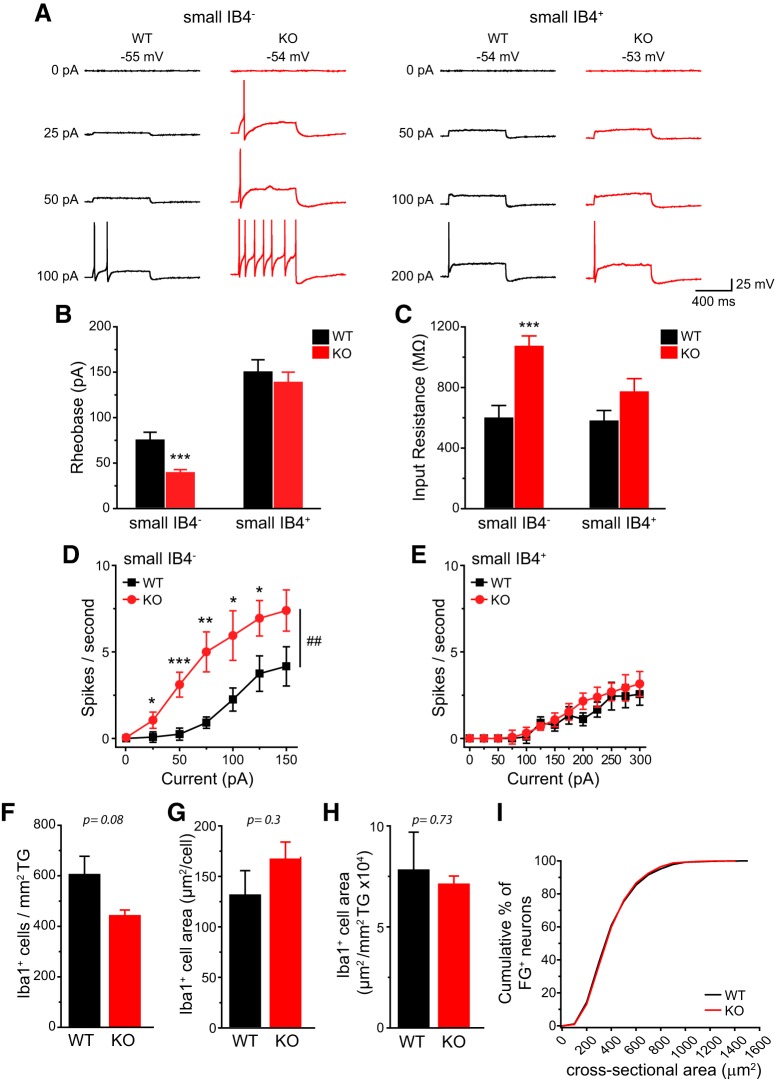
The small IB4− dural afferent neurons from TRESK KO mice show higher intrinsic excitability. A, Representative traces of APs generated by incremental depolarizing current injections in FG+ dural afferent neurons from WT and TRESK KO mice. The values of Vrest and the current amplitude are indicated. B, C, Mean rheobase (B) and Rin (C) of FG+ small IB4− and IB4+ dural afferent neurons from WT and KO mice (n = 13–20 neurons in each group; for details of the intrinsic properties of dural afferent neurons, see Table 2). ***p < 0.001; two-tailed t test between the corresponding WT and KO groups. D, E, Input/output plots of the spike frequency in response to incremental depolarizing current injections in small IB4− (D) and small IB4+ (E) dural afferent neurons from WT and KO mice (same neurons as in B). ##p < 0.01; two-way RM ANOVA. *p < 0.05, **p < 0.01, ***p < 0.001; two-tailed t test between the corresponding WT and KO groups. F, The density of Iba1+ macrophages in WT and KO TG (n = 3 mice in each group). G, The mean area of individual Iba1+ macrophages in WT and KO TG (same mice as in F). H, The area of Iba1+ macrophages per mm2 TG in WT and KO mice (same mice as in F). I, Cumulative distributions of the cross-sectional areas of FG+ dural afferent neurons in WT and KO mice (n = 3627 and 3332 FG+ neurons pooled from 4 WT and 4 KO mice, respectively).

