

Abstract
PURPOSE: In spite of advances in therapy for some subtypes, group 3 medulloblastoma continues to portend a poor prognosis. A subpopulation of medulloblastoma cells expressing the cell surface marker CD133 have been posited as possible stem cell like cancer cells (SCLCC), a potential source of drug resistance and relapse. Retinoids have been shown to affect SCLCC in other brain tumors. Based on these findings, we hypothesized that the CD133-enriched cell population group 3 medulloblastoma cells would be sensitive to the novel rexinoid, UAB30. METHODS: Human medulloblastoma cell lines were studied. Cell sorting based on CD133 expression was performed. Both in vitro and in vivo extreme limiting dilution assays were completed to establish CD133 as a SCLCC marker in these cell lines. Cells were treated with either retinoic acid (RA) or UAB30 and sphere forming capacity and CD133 expression were assessed. Immunoblotting was used to assess changes in stem cell markers. Finally, mice injected with CD133-enriched or CD133-depleted cells were treated with UAB30. RESULTS: CD133-enriched cells more readily formed tumorspheres in vitro at lower cell concentrations and formed tumors in vivo at low cell numbers. Treatment with RA or UAB30 decreased CD133 expression, decreased tumorsphere formation, and decreased expression of cancer stem cell markers. In vivo studies demonstrated that tumors from both CD133-enriched and CD133-depleted cells were sensitive to treatment with UAB30. CONCLUSIONS: CD133 is a marker for medulloblastoma SCLCCs. Both CD133-enriched and CD133-depleted medulloblastoma cell populations demonstrated sensitivity to UAB30, indicating its potential as a therapeutic option for group 3 medulloblastoma.
Introduction
Medulloblastoma (MB), a primitive neuroectodermal tumor, is the most common malignant brain tumor in children. It is classified into four molecular subtypes [(WNT, Sonic Hedgehog (SHH), group 3, group 4], each with unique biologic and clinical characteristics [1]. Group 3 tumors account for approximately 25% of MB and have the worst prognosis of all 4 subtypes [1], [2], [3]. Despite aggressive treatment with surgery, radiotherapy, and multiple drug chemotherapy, overall mortality remains high for group 3 tumors at approximately 50% [1], [2], [3], [4]. In addition, many survivors suffer from significant post-treatment complications including neurocognitive deficits, hormone dysfunction, and hearing loss [5], [6].
Retinoids are vitamin A derivatives that induce cell differentiation and cause growth arrest. Retinoids have demonstrated promising anti-tumor effects in numerous human malignancies, including both adult and pediatric brain tumors [7], [8], [9], [10], [11]. Previous studies have demonstrated that 9-cis-retinoic acid decreased MB cell growth in vitro and in vivo in a flank tumor model [7], [12]. However, the use of 9-cis-retinoic acid and other related retinoids in cancer therapy has been limited in the clinical setting by their toxicities [13].
9-cis-UAB30 [8-(3′,4′-dihydro-1′(2′H)-naphthalen-1′-ylidene)-3,7-dimethyl-2,4,6- octatrienoic acid] (UAB30) is a synthetic analog of 9-cis-retinoic acid that potently and selectively binds the retinoid X receptor (RXR) with limited or antagonistic retinoic acid receptor alpha (RARα) binding activity [14]. This novel rexinoid has reduced toxicity but retains the ability to activate genes involved in differentiation and apoptosis [15], [16], [17]. A pilot clinical trial of UAB30 in humans demonstrated a favorable toxicity and pharmacokinetic profile with no significant change in serum triglycerides [18].
Previously, we demonstrated the efficacy of UAB30 in decreasing tumorigenicity of group 3 medulloblastomas in vitro and in vivo19. We demonstrated that UAB30 significantly decreased tumor cell viability, proliferation, migration, and invasion. In addition, UAB30 treatment induced cell cycle arrest and increased apoptosis. We assessed the efficacy of UAB30 in an in vivo flank model as well as an orthotopic model to demonstrate the ability of this therapy to cross the blood–brain barrier. These findings suggested a therapeutic potential for UAB30 in medulloblastoma warranting further investigation.
There is a subset of tumor cells with stem cell-like properties known as stem cell-like cancer cells (SCLCC). These cells are thought to be responsible for MB tumor progression and relapse [20]. In multiple malignancies, CD133 has been identified as a marker of SCLCC, and previous studies have suggested this to be the case in MB as well [21], [22]. Therefore, those cells with the CD133 cell surface marker may be the source of resistance and recurrence frequently seen in patients with group 3 MB, making them a critical target for therapy. We previously found that treatment with UAB30 decreased the ability of MB cells to form tumorspheres in vitro, a hallmark phenotype of SCLCC. Our current study sought to build on this finding by establishing a marker for SCLCC in MB and exploring the effect of UAB30 on the SCLCC specifically.
Methods
MB Human Cell Line Xenografts
Three group 3 MB human cell line xenografts [23], [24] established from pediatric patients were used for experiments: D341 Med (D341), D384 Med (D384), and D425 Med (D425); kindly provided by Darell D. Bigner, MD, PhD, Duke University Medical Center [25], [26].
All animal experiments described below were approved by the UAB Institutional Animal Care and Use Committee (IACUC-9803) and conducted within institutional, national, and international guidelines.
The cell lines were maintained through serial passage in athymic nude mice (Envigo, Prattville, AL). Tumors were harvested and cells were dissociated using a Tumor Dissociation Kit (Miltenyi Biotec, San Diego, CA) per manufacturer’s protocol. Cells were then washed in Roswell Park Memorial Institute (RPMI) 1640 medium, spun (150 × g × 6 minutes), and debris removed using a 70 μm cell strainer (Corning Inc., Corning, NY). Cells were maintained under standard culture conditions at 37 °C and 5% CO2, in neurobasal medium (Life Technologies, Carlsbad, CA) supplemented with B-27 without Vitamin A (Life Technologies), N2 (Life Technologies), amphotericin B (250 μg/mL), gentamicin (50 μg/mL), L-glutamine (2 mM), epidermal growth factor (10 ng/mL; Miltenyi Biotec), and fibroblast growth factor (10 ng/mL; Miltenyi Biotec). Subcutaneous D341, D384 and D425 xenografts were harvested under sterile conditions and dissociated to a single cell solution using the Tumor Dissociation Kit, human (Miltenyi, Bergisch Gladbach, Germany) according to the manufacture’s protocol and cells subsequently maintained in the described media. A new tumor was harvested and dissociated for each biologic replicate. All three MB human cell line xenografts were verified within the last 12 months using short tandem repeat analysis [Heflin Center for Genomic Sciences, University of Alabama, Birmingham (UAB), Birmingham, AL].
Antibodies and Reagents
Mouse monoclonal anti-CD133 (ab19898) and anti-Oct4 (ab18976) were from Abcam (Cambridge, MA). Mouse monoclonal anti-Sox2 (2748S) was from Cell Signaling (Danvers, MA). Mouse monoclonal anti-β-actin (A1978) was from Sigma Aldrich (St. Louis, MO). 13-cis-retinoid acid (RA) was purchased from Sigma (R3255 Sigma, CAS Number 4759-48-2). UAB30 was synthesized as previously described [27].
Separation of Cells into CD133-Enriched and CD133-Depleted Populations
Cells were separated into CD133-enriched or CD133-depleted populations based on the cell surface expression of CD133. The CD133 MicroBead Kit – Tumor Tissue, human (Miltenyi) was utilized according to manufacturer’s protocol. In brief, cells were incubated with FcR Blocking Reagent followed by magnetic CD133 MicroBeads for 20 minutes at 4 °C. Cells were washed with buffer and placed onto LS or MS magnetic columns (Miltenyi) and placed in the magnetic field of a MACS Separator. The flow-through containing unlabeled cells was collected as CD133-depleted cells. After washing the column with buffer three times, the column was removed from the magnetic field. Magnetically labeled cells were flushed from the column using a plunger and collected as CD133-enriched cells.
In Vitro Limiting Dilution Sphere Assay
Cells were plated into 96 well ultra-low attachment plates using serial dilutions with 5000, 1000, 500, 100, 50, 20, 10, or 1 cell per well with at least 10 replicates per dilution. Cells were plated into culture media as described above combined with 50% conditioned medium. Conditioned media was harvested after 24–48 hours of culture with healthy cells and was specific to each of the three MB cell types. Once spheres were present in the wells containing the most cells, all wells were counted. Extreme limiting dilution analysis software was utilized to analyze the data (http://bioinf.wehi.edu.au/software/elda/).
In Vivo Limiting Dilution Studies
Six-week-old female athymic nude mice (Envigo) were maintained in a pathogen-free facility with static conventional housing, standard 12-hour light/dark cycles, and ad libitum access to Harlan Rodent Diet® Teklad 4% fat mouse/rat chow (Envigo), and water. Tumor volumes were measured with calipers twice weekly and calculated using the formula (width [2] × length)/2, where the length is the largest measurement.
For the in vivo D341 tumorigenic assays, three cell concentrations were chosen: 5 × 10 [3], 5 × 10 [4], and 1 × 10 [5]. Cells were injected subcutaneously in the right flank of 30 athymic nude mice (n = 15 CD133-enriched; n = 15 CD133-depleted), and animals were followed for tumor growth. For the D384 in vivo tumorigenic assay, concentrations of 5 × 10³ and 1 × 10⁵ cells were injected into 20 athymic nude mice (n = 10 CD133-enriched; n = 10 CD133-depleted) and animals were followed for tumor growth. For the D425 assay, 3 different cell concentrations were utilized: 1 × 10 [3], 5 × 10 [3], and 5 × 10 [4]. Cells were injected into 40 mice (n = 20 CD133-enriched; n = 20 CD133-depleted) and animals followed for tumor growth. Animals were humanly euthanized and tumors harvested with IACUC parameters were met. Flow cytometry for detection of CD133 expression was performed as described below. For the D341 cells, tumors from the 5 × 10³ groups were utilized for flow cytometry analysis of CD133. For the D384 cells, tumors from the 1 × 10⁵ groups were used to provide enough tumor tissue for analysis.
Flow Cytometry
Cultured cells or dissociated tumor cells were labeled with human CD133/1 (AC133)-allophycocyanin (APC) antibody (Miltenyi) according to the manufacturer’s instructions. Unlabeled cells were used as controls. The percent of cells positive for APC was determined via flow cytometry using the BD FACSCalibur™ platform (BD Biosciences, Franklin Lakes, NJ). All analyses were performed using FlowJo software (BD Biosciences).
Immunoblotting
Whole-cell or tissue lysates were isolated in radioimmunoprecipitation (RIPA) buffer supplemented with protease inhibitors (Sigma Aldrich), phosphatase inhibitors (Sigma Aldrich), and phenylmethanesulfonylfluoride (Sigma Aldrich). Lysates were centrifuged at 14000 rpm for 30 minutes at 4 °C. Protein concentrations were determined using Pierce™ BCA Protein Assay (Thermo Fisher Scientific) and separated by electrophoresis on sodium dodecyl sulfate polyacrylamide (SDS-PAGE) gels. Molecular weight markers (Precision Plus Protein Kaleidoscope, Bio-Rad, Hercules, CA) were used to confirm the expected size of the proteins of interest. Immunoblots were developed with Luminata Classico or Crescendo Western HRP Substrate (EMD Millipore). Blots were stripped with stripping solution (Bio-Rad) at 65 °C for 20 minutes and then re-probed with selected antibodies. Equal protein loading was confirmed using β-actin. Densitometry was performed using Scion Image Program. Each band was normalized to background on the blot, and then normalized to their respective actin band. All bands were compared to the 0 μM treatment group, which was given the value of 1 as previously reported [28].
Viability Assay
Cell viability was determined using an alamarBlue® assay at 5 days after treatment with vehicle [dimethyl sulfoxide (DMSO), control] RA or UAB30 at increasing concentrations. Following cell separation, the cells (1.5 × 10 [3]) were plated in 96-well culture plates and after 5 days incubation, 10 μL of sterile alamarBlue® dye (Thermo Fisher) was added to each well. After 6 hours, the absorbance at 570 nm and 600 nm
was performed using a microplate reader (Epoch Microplate Spectrophotometer, BioTek Instruments, Winooski, VT). Background absorbance of media alone was subtracted and viability reported as fold change ± SEM.
Proliferation Assay
Cell proliferation was measured using the CellTiter 96® Aqueous Non-Radioactive Cell Proliferation Assay (Promega, Madison, WI). CD133-enriched or CD133-depleted D341, D384, or D425 cells (5 x 10³ per well) were plated in 96-well plates and treated with vehicle, RA or UAB30 (0, 10, 30, 100 μM) for 5 days. Following treatment, 10 μL of CellTiter 96® reagent was added to each well and the absorbance was read at 490 nm using a microplate reader (Epoch Microplate Spectrophotometer, BioTek Instruments). Background absorbance of media alone was subtracted and proliferation was reported as fold change.
In Vivo Tumor Growth
D341 cells were separated into CD133-enriched and CD133-depleted populations and injected into the (5 × 10³ CD133-enriched and 1 × 10⁵ CD133-depleted in 25% Matrigel™; Corning Inc.) right flank of 6-week-old, female, athymic nude mice (Envigo). After injection, the mice were randomized to receive vehicle-treated or UAB30-treated chow (100 mg/kg/day) (n = 5 mice per group). This dosage was based upon previous in vivo experiments [29], [30], [31]. The flank tumors were measured twice weekly using calipers. Tumor volume was calculated using the formula (width [2] × length)/2, where length was the largest measurement. The mice were treated for 7 weeks and all animals euthanized at that time when the majority of the control tumors had reached IACUC parameters for euthanasia.
Statistical Analyses
Experiments were performed at a minimum of triplicate. Data reported as the mean ± standard error of the mean. Data between groups was compared using an analysis of variance or Student’s t-test as appropriate. Statistical significance was defined as P ≤ .05.
Results
CD133 is a Marker of SCLCC in MB
Tumorsphere formation in vitro is a sign of self-renewal, an important characteristic of SCLCCs. Both D341 and D425 cells were sorted using a magnetic cell sorting system into CD133-enriched and CD133-depleted populations. These cells were then plated for an extreme limiting dilution assay (ELDA), which demonstrated significantly greater tumorsphere formation at lower cell concentrations in the CD133-enriched population in both the D341 (Figure 1A (Figure 1B) MB cell lines. Representative photomicrographs of tumorspheres are provided for illustration (Figure 1, A and B lower panels). The decreased tumorsphere formation in CD133-depleted populations implied a less SCLCC phenotype. Additionally, CD133-enriched cells expressed higher levels of stem cell markers Oct4, Nanog, and Sox2, as demonstrated in the D425 cell line (Supplementary Data Figure 1). D384 cells did not form tumorspheres in non-adherent culture conditions and could therefore not be evaluated with ELDA.
Figure 1.

CD133-enriched cells more readily formed tumorspheres. A, D341 cells were magnetically sorted into CD133-enriched and CD133-depleted populations. Cells were plated for an extreme limiting dilution assay (ELDA) with 5000, 1000, 100, 50, 20, 10, and 1 cell per well. CD133-enriched cells formed spheres at significantly lower cell concentrations than the CD133-depleted cells. Representative photomicrographs showing decreased number of tumorspheres in the CD133 enriched versus CD133 depleted populations. B, D425 cells were similarly sorted and plated for ELDA with 5000, 1000, 100, 50, 20, 10, and 1 cell per well. CD133-enriched cells formed spheres at significantly lower cell concentrations than the CD133-depleted cells. Representative photomicrographs showing decreased number of tumorspheres in the CD133-enriched versus CD133-depleted populations.
Supplementary data Figure 1.
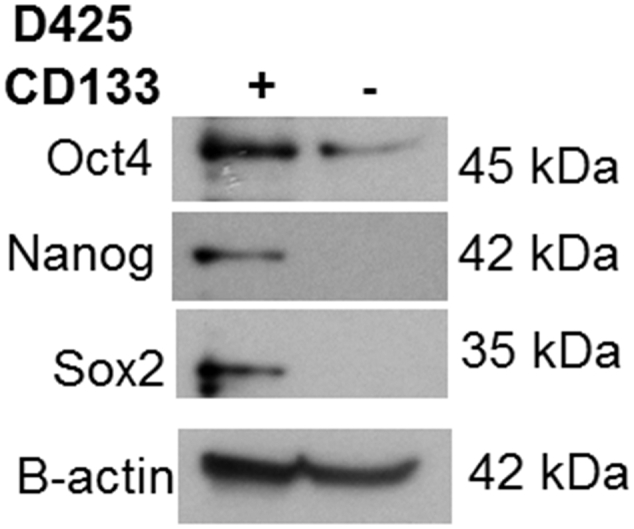
Stemness markers were more abundant in CD133-enriched versus CD133-depleted D425 cell populations. D425 MB tumors were dissociated and separated by magnetic bead sorting into CD133-enriched and CD133-depleted populations. Immunoblotting of whole cell lysates for stemness markers Oct4, Nanog and Sox2 was performed. All proteins were more prominent in the CD133-enriched versus CD133-depleted cells. β-actin served as internal loading control.
In vivo limiting dilution assays are a standard measure to determine the stemness of a cell population. D341 cells were sorted into CD133-enriched and depleted populations and injected in the flank of athymic nude mice. For the CD133-enriched population, three sets of five mice were injected; one set with 5.0 × 10³ cells, one with 5.0 × 10⁴ cells, and one with 1.0 × 10⁵ cells. This schema was repeated with the CD133-depleted cells. By 23 days after injection, there was a statistically significant difference in the number of tumor-bearing mice between the CD133-enriched and depleted cells (Supplementary Data Figure 2A). The mice injected with CD133-enriched cells developed tumors earlier and all animals with CD133-enriched cells ultimately grew a tumor (Supplementary Data Figure 2A) which was not the case in the CD133-depleted population. The CD133-enriched tumors were also larger in volume (Figure 2A). Flow cytometry was utilized to confirm that the CD133-enriched and depleted populations maintained their CD133 status while in vivo. Tumors from the CD133-enriched cells maintained a significantly higher percentage of CD133+ cells than those from the CD133-depleted cells after 4 weeks in vivo (Figure 2B). The in vivo assay was repeated for D384 cells with similar results. Tumors grew earlier in the CD133-enriched population (Supplementary Data Figure 2B), and the tumors were significantly larger in volume (Figure 2C)). Similarly, flow cytometry demonstrated that the CD133-enriched cells maintained significantly higher percentage of cells that were CD133+ following growth in vivo (Figure 2D). Finally, comparable results for tumor growth (Supplementary Data Figure 2C) and tumor volumes (Figure 2D)) were seen when the in vivo experiment was performed with D425 cells. The findings from both in vitro and in vivo experiments supported CD133 as a marker of stemness in these human MB cells.
Figure 2.

CD133-enriched D341, D384 and D425 cells demonstrated increased tumor growth in vivo. A, D341 cells were magnetically sorted into CD133-enriched and depleted populations. Within each group, 5 × 10³ (n = 5 / group) cells were injected into the right flank of athymic nude mice. Tumor volume measurements were taken every 3–4 days. After 23 days, the CD133-enriched cells formed tumors in 5 of 5 mice compared to only 0 of 5 mice in the CD133-depleted group. The CD133-enriched population grew significantly larger tumors than the CD-133 depleted cell population. B, Tumors from the 5 × 10³ groups were harvested and dissociated into single cell suspension. Flow cytometry was utilized to detect CD133 expression. CD133 levels remained significantly greater in the CD133-enriched tumors compared to tumors from the CD133-depleted cell population. C, D384 cells were magnetically sorted into CD133-enriched and depleted populations. Within each group 5 × 10³ (n = 5 / group) cells were injected into the right flank of athymic nude mice. After 30 days, 4 of 5 mice injected with CD133-enriched cells had tumors compared to none of the mice that were injected with CD133-depleted cells. Tumor volume measurements were taken every 3–4 days and the CD133-enriched population grew significantly larger tumors than the CD133-depleted tumors. D, Tumors from the 1 × 10⁵ groups were harvested and dissociated into single cell suspension to have enough tumor cells for analysis. Flow cytometry was utilized to detect CD133 expression. CD133 levels remained significantly greater in the CD133-enriched tumors. E, D425 cells were magnetically sorted into CD133-enriched and depleted populations. Within each group 1.0 × 10³ (n = 10 / group) cells were injected into the right flank of athymic nude mice. By 20 days, all 10 mice in the CD133-enriched group developed tumors compared to only 2 of 10 in the CD133-depleted group. Tumor volume measurements were taken every 3–4 days and the CD133-enriched population grew significantly larger tumors than the CD133-depleted group.
RA and UAB30 Treatment Decreased CD133 Expression
Once CD133 was established as a marker of stemness in these MB cells, we sought to determine the effect of retinoids on CD133 expression. First, a baseline CD133 level was determined in all three human MB xenograft cell lines. Three to four biologic replicates or each cell line were utilized. In D341, an average of 50.4% of cells expressed CD133, 52.4% of cells expressed CD133 in D384, and 45.1% of cells expressed CD133 in D425 (Figure 3A). Cells were treated with retinoic acid (5 or 10 μM) or UAB30 (5 or 10 μM) for 72 hours and CD133 expression was evaluated with flow cytometry and compared to untreated cells (control). There was a significant decrease in CD133 expression in all three human MB xenograft cell lines following treatment with retinoic acid or UAB30 compared to control cells (Figure 3B).
Figure 3.

CD133 expression was decreased after RA and UAB30. A, Flow cytometry was used to determine the baseline CD133 expression in untreated D341, D384, and D425 cells. B, D341 and D425 cells were treated with vehicle (control) or RA or UAB30 (10 μM) and D384 cells were treated with vehicle (control) or RA or UAB30 (5 μM) for 48 hours. Cells were fixed, stained with CD133 antibody, and analyzed using flow cytometry. There was a significant decrease in CD133 expression in all three MB cell lines following RA and UAB30 treatment compared to untreated control cells. Data were reported as fold change percent cells ± SEM expressing CD133.
RA and UAB30 Treatment Affected the SCLCC Phenotype
Because tumorsphere formation is a marker of stemness, we used a tumorsphere formation ELDA to determine the effect of retinoid therapy on the ability of the enriched and depleted populations to form tumorspheres. D341 and D425 cells were sorted into CD133-enriched and depleted populations and treated with RA (10 μM) or UAB30 (10 μM) and compared to untreated controls. In the D341 cell line, both the CD133-enriched and CD133-depleted cells demonstrated a significant decrease in tumorsphere formation when treated with either RA or UAB30 (Figure 4A). Similar results were noted in D425 cells, with tumorsphere formation decreasing in both the CD133-enriched and depleted populations following treatment with RA or UAB30 (Figure 4B). D384 cells lacked the ability to form tumorspheres and thus could not be analyzed utilizing this phenotypic property. Representative photomicrographs of tumorspheres of CD133 enriched and depleted cells with and without treatment with RA or UAB30 are provided (Figure 4, A and B, right panels).
Figure 4.

RA and UAB30 decreased tumorsphere formation. A, D341 and B, D425 cells were magnetically sorted and plated in 96 well plates with decreasing number of cells per well. The cells were treated with conditioned neurobasal media with vehicle or conditioned neurobasal media with RA or UAB30 (10 μM). The number of wells with sphere formation were counted and analyzed as an ELDA. There was significantly less tumorsphere formation in those cells treated with RA or UAB30 than the control in both the CD133-enriched and depleted population in both cell lines. Representative photomicrographs showing decreased number of tumorspheres following treatment with RA or UAB30.
Sex determining region Y-box 2 (Sox2), a member of the SoxB1 transcription factor family, is an important transcriptional regulator in pluripotent stem cells [32]. Together with octamer-binding transcription factor 4 (Oct4), they co-operatively control gene expression pluripotency in stem cells [32]. Therefore, when cells become less stem-like, expression of these markers decreases; prompting an examination of these markers in MB cells after RA or UAB30 treatment. Immunoblotting was used to examine the expression of these markers in D341, D384, and D425 cells. Expression of Oct4 and Sox2 in D341 cells following treatment with RA and UAB30 was decreased (Figure 5A). D384 cells also demonstrated decreased Oct4 and Sox2 expression after treatment with RA and UAB30 (Figure 5B). Finally, there was a decrease in expression of Oct4 and Sox2 in D425 lysates treated for 72 hours with RA or UAB30 (Figure 5C). Expression of these proteins was also evaluated in separated populations, and again, expression tended to decrease with treatment with either RA or UAB30 (Supplementary Data Figure 3). These findings demonstrated that proteins known to maintain SCLCC were decreased after RA and UAB30 treatment.
Figure 5.

Treatment with RA and UAB30 decreased stemness markers in MB cells. Cells were treated with RA or UAB30 and whole cell lysates underwent immunoblotting for stemness markers. A D341 cells were treated with RA or UAB30 (0, 10 μM) for 48 hours. Immunoblotting for Oct4 showed decreased expression after treatment with RA or UAB30 (top panel). Cells were treated with RA or UAB30 (0, 10, 30 μM) for 5 days and lysates examined for Sox2. Sox2 expression was decreased with RA or UAB30 treatment (bottom panel). B D384 cells were treated with RA or UAB30 (0, 10 μM) for 72 hours, and immunoblotting performed for Oct4 (top panel) and Sox2 (bottom panel). Both proteins were decreased with RA or UAB30 treatment. C D425 cells were treated with RA or UAB30 (0, 10, 30 μM) for 72 hours. Immunoblotting for Oct4 and Sox2 revealed decreased expression of these proteins following RA or UAB30 treatment. Densitometry was utilized to evaluate the bands, providing confirmatory evidence that RA and UAB30 decreased expression of stemness markers.
Supplementary data Figure 3.

Treatment with RA and UAB30 decreased stemness markers in sorted MB cells. Cells were sorted into CD133-enriched and CD133-depleted populations. Cells were treated for treated with RA or UAB30 and whole cell lysates underwent immunoblotting for stemness markers. A D341 CD133-enriched (left panel) or CD133-depleted (right panel) cells were treated with RA or UAB30 (0, 10 µM) for 48 hours. Immunoblotting for Oct4 showed decreased expression after treatment with RA or UAB30. Sox2 expression was slightly decreased with UAB30 treatment in the CD133-depleted population B D425 CD133-enriched (left panel) or CD133-depleted (right panel) cells were treated with RA or UAB30 (0, 10 µM) for 72 hours. Immunoblotting for Oct4 (upper panels) and Sox2 (lower panels) revealed decreased expression of these proteins following UAB30 treatment.
RA and UAB30 had similar effect on viability and proliferation in both CD133-enriched and depleted populations
SCLCC have been hypothesized to be the source of chemoresistance in certain malignancies [20]. Because the CD133-enriched cells demonstrated the ability to more readily form tumorspheres and express those factors involved in pluripotency, we wanted to confirm that this population would not escape the effects of RA and UAB30 in vitro. AlamarBlue® assay was used to assess the effect of RA and UAB30 on CD133-enriched and depleted cell populations in D341, D384 and D425 cell lines. We found that RA and UAB30 significantly decreased cell viability of both CD133-enriched and depleted populations in all three human MB xenograft cell lines (Figure 6, A–C). Next the effect of RA and UAB30 on proliferation in CD133-enriched and depleted populations was assessed. Once again, RA or UAB30 significantly decreased proliferation in both the enriched and depleted population in all three cell lines (Figure 6, D–F). There was no strong evidence that the CD133-enriched population was more resistant to either RA or UAB30 in terms of viability or proliferation than the CD133-depleted population.
Figure 6.

Treatment with RA and UAB30 decreased viability and proliferation in CD133-enriched and depleted cells. A-C D341, D384, and D425 were magnetically sorted, cells were plated on 96 well plates and treated with vehicle or increasing doses of RA and UAB30 (0, 10, 30, 100 μM for D341 and D425; 0, 1, 10, 30 μM for D384). Viability was measured after 5 days of treatment using alamarBlue® assay. In all three cell lines, treatment with RA and UAB30 significantly decreased viability. Results were similar for both the CD133-enriched and depleted populations. D-F Proliferation was measured with CellTiter 96® assay after 5 days of treatment. Similar to viability, proliferation was significantly decreased following RA or UAB30 treatment in all three cell lines, and the CD133-enriched populations were as sensitive to treatment as the CD133-depleted populations.
CD133-enriched MB cells remained sensitive to UAB30 in vivo
We have previously shown that UAB30 decreased MB growth in vivo19. We sought to determine whether CD133-enriched cells were resistant to UAB30 treatment in vivo in comparison to a CD133-depleted population. D341 cells were magnetically sorted, and 5 × 10³ CD133-enriched and 1 × 10⁵ CD133-depleted cells were injected into the right flank of athymic nude mice. The flank site was utilized in order to monitor tumor growth over time in a more precise manner than is possible with intracranial injection. These cell numbers were based upon the in vivo limiting dilution assay (Supplementary Data Figure 2). At the time of tumor cell injection, the mice were randomized to be treated with vehicle-treated or UAB-treated chow (100 mg/kg/day) (n = 5 animals/group). This dose was based on previous studies [33]. The tumors were measured twice weekly, and animals euthanized once IACUC parameters were met. Both sets of mice grew tumors, and both the enriched and depleted population demonstrated a significant change in tumor volume when treated with UAB30 (Figure 7, A and B). The changes in tumor volume reach statistical significance by 22 days in both groups (Figure 7, A and B). These findings suggested that CD133-enriched cells were not resistant to UAB30 in vivo. The histology of the tumors was examined. The phenotypes of the tumor cells themselves were not significantly different, but the untreated tumors tended to have larger areas of necrosis than the treated tumors (Figure 7C, closed arrows) (37 ± 5% vs 20 ± 5%, P = .02, CD133 enriched untreated vs. treated top panel; 55 ± 10% vs 12 ± 6%, P = .07, CD133 depleted untreated vs treated, bottom panel) likely secondary to the larger size of the untreated tumors.
Supplementary data Figure 2.

CD133-enriched D341, D384 and D425 cells demonstrated increased tumor growth in vivo. A D341 cells were magnetically sorted into CD133-enriched and depleted populations. Within each group, either 5 × 10³ (n = 5), 5 × 10⁴ (n = 5), or 1.0 × 10⁵ (n = 5) cells were injected into the right flank of athymic nude mice. After 27 days, the CD133-enriched cells formed tumors in 5 of 5 mice in the lowest concentration groups compared to only 1 of 5 mice injected with the CD133-depleted cells. CD133-enriched tumors also began growing earlier (20 days vs. 27 days). B D384 cells were magnetically sorted into CD133-enriched and depleted populations. Within each group, either 5 × 10³ (n = 5) or 1 × 10⁵ (n = 5) cells were injected into the right flank of athymic nude mice. After 34 days, 4 of 5 mice injected with the smallest concentration of CD133-enriched cells had tumors compared to none of the mice that were injected with CD133-depleted cells. In addition, even at the higher cell number, the CD133-enriched tumors began growing earlier (19 days versus 30 days) than the CD133-depleted tumors. C D425 cells were magnetically sorted into CD133-enriched and depleted populations. Within each group, either 1.0 × 10³ (n = 10), 5.0 × 10³ (n = 5), or 5.0 × 10⁴ (n = 5) cells were injected into the right flank of athymic nude mice. In the cohort with the least amount of cells, by 28 days, all 10 mice in the CD133-enriched group developed tumors compared to only 2 of 10 in the CD133-depleted group.
Figure 7.

UAB30 decreased tumor growth in vivo in both CD133-enriched and depleted cells. D341 cells were magnetically sorted. CD133-enriched cells (5 × 10³ in 25% Matrigel™) were injected in the right flank of athymic nude mice (n = 5) and the same was done with CD133-depleted cells (1 × 10⁵ cells in 25% Matrigel™) (n = 5). Mice were randomized to receive either vehicle-treated chow or UAB-treated chow (100 mg/kg/day). Tumors were measured twice per week and mice were euthanized when tumors met IACUC parameters. A In the CD133-enriched population there was a significant difference in tumor volume as early as 22 days, with significantly smaller volume tumors in the UAB30-treated cohort. B In the CD133-deleted population there was also a significant difference in tumor volume as early as 22 days, with significantly smaller volume tumors in the UAB30-treated cohort. C Histology on the tumors revealed that the vehicle treated tumors tended to have larger areas of necrosis (open arrows) than the UAB30-treated tumors. This finding held true for both the CD133-enriched and CD133-depleted tumors.
Discussion
In spite of the major advances in cancer therapies over the last 50 years, the prognosis for patients with group 3 MB remains poor. Current standard therapy options are associated with dose-limiting toxicities, long term morbidities, and frequent tumor recurrence.
SCLCCs have become an important target for therapy as we seek to eliminate sources of resistance and recurrence in a cancer cell population. Established markers of these SCLCCs have been identified in several types of malignancies [20]. One such marker, CD133, has been identified as a SCLCC marker for several types of malignancies [20]. In 2004 it was suggested that CD133 may be a marker for SCLCCs in MB22, but this concept was initially met with some debate. Read et al. demonstrated that implantation of CD133+ MB cells in a xenograft model did not result in the growth of tumors, while the implantation of CD133- cells did, and they sought to investigate other potential markers such as CD15 [34]. Over the next decade further investigation has been done to establish the legitimacy of CD133 or CD15 as a SCLCC marker for MB without providing conclusive evidence either way [35].
The studies presented here provide support for CD133 as a marker of SCLCC in these 3 MB cell lines. Using an in vitro ELDA it was demonstrated that the CD133-enriched cells had a higher propensity to form tumorspheres at lower cell concentrations than the CD133-depleted population in the D341 and D425 and MB cell lines. In addition and more importantly, in all three human MB xenograft cell lines an in vivo ELDA demonstrated that the CD133-enriched cells were more tumorigenic with increased likelihood for a tumor to grow, and increased tumor volume overall when compared to the CD133-depleted cells.
Once we established CD133 as a marker of SCLCCs in these cell lines we evaluated a potential novel therapy for MB. The use of RA as a cancer therapeutic is well documented including for MB. In fact, a Children’s Oncology Group study, ACNS0332, which opened in 2007 for high-risk MB, initially included a randomization for RA. At the time of trial inception, there was a lack of the current understanding of the significant tumor heterogeneity in MB, which was subsequently revealed by genomic data. By 2012, consensus emerged that there are at least four distinct molecular subgroups of MB that differ in their transcriptomes, somatic genetic events, and clinical outcomes [36], and even more recent data have emerged demonstrating that significant molecular heterogeneity exists within the four subgroups [37]. These findings have led to major changes in risk stratification of MB patients and clinical trial designs. Therefore, based on lack of genomic based eligibility criteria used for ACNS0332, it is not surprising that a futility analysis concluded that treatment of MB with RA as performed in the context of the study would not lead to a significant survival advantage. It is possible that RA will provide clinical benefit to patients with a specific molecular subgroup or subgroups of MB may benefit from this therapy.
One of the primary drawbacks to RA is the toxicity associated with the therapy. The novel rexinoid, UAB30, was designed with the goal of maintaining the anti-cancer properties of a retinoid, while decreasing the dose limiting toxicities. The safety and favorable side effect profile of UAB30 has already been established [18]. We have previously shown that both RA and UABA30 were equally effective in decreasing MB cell proliferation, survival, and motility in vitro as well a tumor growth in vivo19, but we wanted to investigate whether UAB30 could decrease tumor cell stemness, eliminating any resistance afforded by the SCLCCs. In the current study, we showed that treatment with RA and UAB30 resulted in a decrease in percentage of CD133-enriched cells, tumorsphere formation, and expression of stem cell markers. Additionally, we demonstrated that the CD133-enriched population was sensitive to UAB30 treatment both in vivo and in vitro. These findings did not necessarily imply that “stemness” is mandatory for response to UAB30, but, importantly, indicated that the CD133-enriched population is not resistant to UAB30
Since effects of RA and UAB30 were not significantly different in vitro, we chose to focus on UAB30 for the in vivo experiments. Because we had already established that UAB30 can effectively treat an orthotopic tumor model, we utilized a flank model for the current studies due to the benefit of being able to directly measure tumor size with calipers serially over time as opposed to the limitation of relying on the development of neurologic symptoms or two-dimensional imaging as a marker of intracranial tumor growth. Development of neurologic symptoms is extremely variable depending on exact location of the tumor and often manifests as premature death independent of tumor size. UAB30 has been tested in both rodents and dogs, and found to be non-toxic at 100 mg/kg/day, the dose chosen for these studies [31]. The ability of UAB30 specifically [19], and retinoids in general, to readily enter the blood–brain barrier has been well documented [38]. Use of the flank model does exclude the contribution of the tumor microenvironment. However, in utilizing an immunosuppressed murine model – as required with human tumor cells - the actual tumor microenvironment is often not well recapitulated due to the lack of immune cells and factors that play a key role in tumor cell growth. Further, the use of flank models for in vivo cancer stem cell studies has been well reported in the literature [39], [40], [41].
While these findings demonstrate that UAB30 decreased the stemness of MB tumor cells and effectively treated the SCLCC population, the mechanisms involved remain unclear. Retinoids and rexinoids affect the expression of over 200 genes through binding to the RAR (Retinoic Acid Receptor) or RXRs (Retinoid X Receptors) [42]. Previously we have shown that all three cell lines express the rexinoid receptor, RXR, which binds UAB30 [19], which is supported by the findings of other investigators [43], [44]. Others have reported in melanoma that binding of various synthetic retinoids to the RAR led to inhibition of melanoma cancer stem cells [45]. Potentially, the activation of these receptors downregulated transcription of genes responsible for generation and maintenance of cancer stem cells [46]. Such a mechanism may explain the decreased expression of CD133, Sox2, and Oct4 seen following all-trans-retinoic acid treatment in MB cells [41]. We postulate, and indicated with similar results, that the same mechanism may be involved in the current studies. Identifying the precise mechanisms involved in this process is the subject of ongoing and future studies.
Patients with group 3 MB are in dire need of novel therapies that are able to target the cancer cells most resistant to treatment. We have found that in addition to decreasing MB cell survival, proliferation, and growth, UAB30 treatment decreased the MB SCLCC phenotype. The inability of CD133-enriched cells to evade this treatment makes it a promising therapeutic avenue for further exploration for patients with group 3 MB.
The following are the supplementary data related to this article.
Compliance with Ethical Standards
Funding
This study was funded in part by University of Alabama, Birmingham, Comprehensive Cancer Center Pilot Grant in Pediatric Cancer (5P30CA013148-40 to G.K.F. and E.A.B.). National Institutes of Health (T32 CA091078 to E.F.G. and L.L.S., T32 CA183926 to A.P.W., and P30 AR048311 and P30 AI27667 to University of Alabama Flow Cytometry Core). Rally Foundation for Childhood Cancer Research and Hyundai Hope on Wheels to G.K.F. Hyundai Hope on Wheels, to E.A.B.
Conflicts of Interest
Adele P. Williams declares that she has no conflict of interest. Evan F. Garner declares that he has no conflict of interest. Laura L. Stafman declares that she has no conflict of interest. Jamie M. Aye declares that she has no conflict of interest. Colin H. Quinn declares that he has no conflict of interest. Raoud Marayati declares that she has no conflict of interest, Jerry E. Stewart declares that he has no conflict of interest. Venkatram R. Atigadda declares that he has no conflict of interest. Elizabeth Mroczek-Musulman declares that she has no conflict of interest. Blake P. Moore declares that he has no conflict of interest. Elizabeth A. Beierle declares that she has no conflict of interest. Gregory K. Friedman declares that he has no conflict of interest.
Ethical Approval Animals
All applicable international, national, and/or institutional guidelines for the care and use of animals were followed.
Ethical Approval Humans
This article does not contain any studies with human participants performed by any of the authors.
References
- 1.Northcott PA, Korshunov A, Witt H, Hielscher T, Eberhart CG, Mack S, Bouffet E, Clifford SC, Hawkins CE, French P. Medulloblastoma comprises four distinct molecular variants. J Clin Oncol. 2011;29(11):1408–1414. doi: 10.1200/JCO.2009.27.4324. [DOI] [PMC free article] [PubMed] [Google Scholar]
- 2.Kool M, Korshunov A, Remke M, Jones DT, Schlanstein M, Northcott PA, Cho YJ, Koster J, Schouten-van Meeteren A, van Vuurden D. Molecular subgroups of medulloblastoma: an international meta-analysis of transcriptome, genetic aberrations, and clinical data of WNT, SHH, Group 3, and Group 4 medulloblastomas. Acta Neuropathol. 2012;123(4):473–484. doi: 10.1007/s00401-012-0958-8. [DOI] [PMC free article] [PubMed] [Google Scholar]
- 3.Cho YJ, Tsherniak A, Tamayo P, Santagata S, Ligon A, Greulich H, Berhoukim R, Amani V, Goumnerova L, Eberhart CG. Integrative genomic analysis of medulloblastoma identifies a molecular subgroup that drives poor clinical outcome. J Clin Oncol. 2011;29(11):1424–1430. doi: 10.1200/JCO.2010.28.5148. [DOI] [PMC free article] [PubMed] [Google Scholar]
- 4.Eberhart CG. Three down and one to go: modeling medulloblastoma subgroups. Cancer Cell. 2012;21(2):137–138. doi: 10.1016/j.ccr.2012.01.013. [DOI] [PMC free article] [PubMed] [Google Scholar]
- 5.Palmer SL, Reddick WE, Gajjar A. Understanding the cognitive impact on children who are treated for medulloblastoma. J Pediatr Psychol. 2007;32(9):1040–1049. doi: 10.1093/jpepsy/jsl056. [DOI] [PubMed] [Google Scholar]
- 6.Diller L, Chow EJ, Gurney JG, Hudson MM, Kadin-Lottick NS, Kawashima TI, Leisenring WM, Meacham LR, Mertens AC, Mulrooney DA. Chronic disease in the Childhood Cancer Survivor Study cohort: a review of published findings. J Clin Oncol. 2009;27(14):2339–2355. doi: 10.1200/JCO.2008.21.1953. [DOI] [PMC free article] [PubMed] [Google Scholar]
- 7.Bai R, Siu IM, Tyler BM, Staedtke V, Gallia GL, Riggins GJ. Evaluation of retinoic acid therapy for OTX2-positive medulloblastomas. Neuro Oncol. 2010;12(7):655–663. doi: 10.1093/neuonc/nop062. [DOI] [PMC free article] [PubMed] [Google Scholar]
- 8.Ying M, Wang S, Sang Y, Sun P, Lal B, Goodwin CR, Guerrero-Cazares H, Quinones-Hinojosa A, Laterra J, Xia S. Regulation of glioblastoma stem cells by retinoic acid: role for Notch pathway inhibition. Oncogene. 2011;30(31):3454–3467. doi: 10.1038/onc.2011.58. [DOI] [PMC free article] [PubMed] [Google Scholar]
- 9.Di C, Liao S, Adamson DC, Parrett TJ, Broderick DK, Shi Q, Lengauer C, Cummins JM, Velculescu VE, Fults DW. Identification of OTX2 as a medulloblastoma oncogene whose product can be targeted by all-trans retinoic acid. Cancer Res. 2005;65(3):919–924. [PubMed] [Google Scholar]
- 10.Karmakar S, Banik NL, Ray SK. Combination of all-trans retinoic acid and paclitaxel-induced differentiation and apoptosis in human glioblastoma U87MG xenografts in nude mice. Cancer. 2008;112(3):596–607. doi: 10.1002/cncr.23223. [DOI] [PubMed] [Google Scholar]
- 11.Karmakar S, Banik NL, Patel SJ, Ray SK. Combination of all-trans retinoic acid and taxol regressed glioblastoma T98G xenografts in nude mice. Apoptosis. 2007;12(11):2077–2087. doi: 10.1007/s10495-007-0116-2. [DOI] [PubMed] [Google Scholar]
- 12.Spiller SE, Ditzler SH, Pullar BJ, Olson JM. Response of preclinical medulloblastoma models to combination therapy with 13-cis retinoic acid and suberoylanilide hydroxamic acid (SAHA) J Neurooncol. 2008;87(2):133–141. doi: 10.1007/s11060-007-9505-1. [DOI] [PubMed] [Google Scholar]
- 13.David M, Hodak E, Lowe NJ. Adverse effects of retinoids. Med Toxicol Adverse Drug Exp. 1988;3(4):273–288. doi: 10.1007/BF03259940. [DOI] [PubMed] [Google Scholar]
- 14.Muccio DD, Brouillette WJ, Breitman TR, Taimi M, Emanuel PD, Zhang X, Chen G, Sani BP, Venepally P, Reddy L. Conformationally defined retinoic acid analogues. 4. Potential new agents for acute promyelocytic and juvenile myelomonocytic leukemias. J Med Chem. 1998;41(10):1679–1687. doi: 10.1021/jm970635h. [DOI] [PubMed] [Google Scholar]
- 15.Grubbs CJ, Hill DL, Bland KI, Beenken SW, Lin TH, Eto I, Atigadda VR, Vines KK, Brouillette WJ, Muccio DD. 9cUAB30, an RXR specific retinoid, and/or tamoxifen in the prevention of methylnitrosourea-induced mammary cancers. Cancer Lett. 2003;201(1):17–24. doi: 10.1016/s0304-3835(03)00461-0. [DOI] [PubMed] [Google Scholar]
- 16.Wu L, Chaudhary SC, Atigadda VR, Belyaeva OV, Harville SR, Elmets CA, Muccio DD, Athar M, Kedishvili NY. Retinoid X receptor agonists upregulate genes responsible for the biosynthesis of All-Trans-Retinoic Acid in human epidermis. PLoS One. 2016;11(4) doi: 10.1371/journal.pone.0153556. [DOI] [PMC free article] [PubMed] [Google Scholar]
- 17.Vedell PT, Lu Y, Grubbs CJ, Yin Y, Jiang H, Bland KI, Muccio DD, Cvetkovic D, You M, Lubet R. Effects on gene expression in rat liver after administration of RXR agonists: UAB30, 4-methyl-UAB30, and Targretin (Bexarotene) Mol Pharmacol. 2013;83(3):698–708. doi: 10.1124/mol.112.082404. [DOI] [PMC free article] [PubMed] [Google Scholar]
- 18.Kolesar JM, Hoel R, Pomplun M, Havighurst T, Stublaski J, Wollmer B, Krontiras H, Brouillette W, Muccio D, Kim K. A Ppilot, Ffirst-in-Hhuman, Ppharmacokinetic Sstudy of 9cUAB30 in Hhealthy Vvolunteers. Cancer Prev Res (Phila) 2010;3(12):1565–1570. doi: 10.1158/1940-6207.CAPR-10-0149. [DOI] [PMC free article] [PubMed] [Google Scholar]
- 19.Garner EF, Stafman LL, Williams AP, Aye JM, Goolsby C, Atigadda VR, Moore BP, Nan L, Stewart JE, Hjelmeland AB. UAB30, a novel RXR agonist, decreases tumorigenesis and leptomeningeal disease in group 3 medulloblastoma patient-derived xenografts. J Neuro-Oncol. 2018;140(2):209–224. doi: 10.1007/s11060-018-2950-1. [DOI] [PMC free article] [PubMed] [Google Scholar]
- 20.Li Z. CD133: a stem cell biomarker and beyond. Exp Hematol Oncol. 2013;2(1):17. doi: 10.1186/2162-3619-2-17. [DOI] [PMC free article] [PubMed] [Google Scholar]
- 21.Garg N, Bakhshinyan D, Venugopal C, Mahendram S, Rosa DA, Vijayakumar T, Manoranjan B, Hallett R, McFarlane N, Delaney KH. CD133 CD133+ brain tumor-initiating cells are dependent on STAT3 signaling to drive medulloblastoma recurrence. Oncogene. 2017;36(5):606–617. doi: 10.1038/onc.2016.235. [DOI] [PMC free article] [PubMed] [Google Scholar]
- 22.Singh SK, Hawkins C, Clarke ID, Squire JA, Bayani J, Hide T, Henkelman RM, Cusimano MD, Dirks PB. Identification of human brain tumour initiating cells. Nature. 2004;432(7015):396–401. doi: 10.1038/nature03128. [DOI] [PubMed] [Google Scholar]
- 23.Snuderl M, Batista A, Kirkpatrick ND, Ruiz de Almodovar C, Riedemann L, Walsh EC, Anolik R, Huang Y, Martin JD, Kamoun W. Targeting placental growth factor/neuropilin 1 pathway inhibits growth and spread of medulloblastoma. Cell. 2013;152(5):1065–1076. doi: 10.1016/j.cell.2013.01.036. [DOI] [PMC free article] [PubMed] [Google Scholar]
- 24.Friedman GK, Moore BP, Nan L, Kelly VM, Etminan T, Langford CP, Xu H, Han X, Markert JM, Beierle EA. Pediatric medulloblastoma xenografts including molecular subgroup 3 and CD133+ and CD15+ cells are sensitive to killing by oncolytic herpes simplex viruses. Neuro-Oncology. 2016;18(2):227–235. doi: 10.1093/neuonc/nov123. [DOI] [PMC free article] [PubMed] [Google Scholar]
- 25.He XM, Skapek SX, Wikstrand CJ, Friedman HS, Trojanowski JQ, Kemshead JT, Coakham HB, Bigner SH, Bigner DD. Phenotypic analysis of four human medulloblastoma cell lines and transplantable xenografts. J Neuropathol Exp Neurol. 1989;48(1):48–68. doi: 10.1097/00005072-198901000-00005. [DOI] [PubMed] [Google Scholar]
- 26.He XM, Wikstrand CJ, Friedman HS, Bigner SH, Pleasure S, Trojanowski JQ, Bigner DD. Differentiation characteristics of newly established medulloblastoma cell lines (D384 Med, D425 Med, and D458 Med) and their transplantable xenografts. Lab Investig. 1991;64(6):833–843. [PubMed] [Google Scholar]
- 27.Atigadda VR, Vines KK, Grubbs CJ, Hill DL, Beenken SL, Bland KI, Brouillette WJ, Muccio DD. Conformationally defined retinoic acid analogues. 5. Large-scale synthesis and mammary cancer chemopreventive activity for (2E,4E,6Z,8E)-8-(3’,4’-dihydro-1’(2’H)-naphthalen-1’-ylidene)-3,7-dimethyl-2,4,6-octatrienoic acid (9cUAB30) J Med Chem. 2003;46(17)):3766–3769. doi: 10.1021/jm030095q. [DOI] [PubMed] [Google Scholar]
- 28.Gillory LA, Stewart JE, Megison ML, Waters AM, Beierle EA. FAK and p53 synergistically decrease neuroblastoma cell survival. J Surg Res. 2015;196(2):339–349. doi: 10.1016/j.jss.2015.03.021. [DOI] [PMC free article] [PubMed] [Google Scholar]
- 29.Waters AM, Stewart JE, Atigadda VR, Mroczek-Musulman E, Muccio DD, Grubbs CJ, Beierle EA. reclinical evaluation of a novel RXR agonist for the treatment of neuroblastoma. Mol Cancer Ther. 2015;14(7):1559–1569. doi: 10.1158/1535-7163.MCT-14-1103. [DOI] [PMC free article] [PubMed] [Google Scholar]
- 30.Waters AM, Stewart JE, Atigadda VR, Mroczek-Musulman E, Muccio DD, Grubbs CJ, Beierle EA. Reclinical evaluation of UAB30 in pediatric renal and hepatic malignancies. Mol Cancer Ther. 2016;15(5):911–921. doi: 10.1158/1535-7163.MCT-15-0521. [DOI] [PMC free article] [PubMed] [Google Scholar]
- 31.Lindeblad M, Kapetanovic IM, Kabirov KK, Dinger N, Mankovskaya I, Morrisey R, Martín-Jiménez T, Lyubimov A. Assessment of oral toxicity and safety of 9-cis-UAB30, a potential chemopreventive agent, in rat and dog studies. Drug Chem Toxicol. 2011;34(3):300–310. doi: 10.3109/01480545.2010.536771. [DOI] [PubMed] [Google Scholar]
- 32.Amini S, Fathi F, Mobalegi J, Sofimajidpour H, Ghadimi T. The expressions of stem cell markers: Oct4, Nanog, Sox2, nucleostemin, Bmi, Zfx, Tcl1, Tbx3, Dppa4, and Esrrb in bladder, colon, and prostate cancer, and certain cancer cell lines. Anat Cell Biol. 2014;47(1):1–11. doi: 10.5115/acb.2014.47.1.1. [DOI] [PMC free article] [PubMed] [Google Scholar]
- 33.Grubbs CJ, Lubet RA, Atigadda VR, Christov K, Deshpande AM, Tirmal V, Xia G, Bland KI, Eto I, Brouillette WJ. Efficacy of new retinoids in the prevention of mammary cancers and correlations with short-term biomarkers. Carcinogenesis. 2006;27(6):1232–1239. doi: 10.1093/carcin/bgi308. [DOI] [PubMed] [Google Scholar]
- 34.Read TA, Fogarty MP, Markant SL, McLendon RE, Wei Z, Ellison DW, Febbo PG, Wechsler-Reya RJ. Identification of CD15 as a marker for tumor-propagating cells in a mouse model of medulloblastoma. Cancer Cell. 2009;15(2):135–147. doi: 10.1016/j.ccr.2008.12.016. [DOI] [PMC free article] [PubMed] [Google Scholar]
- 35.Huang GH, Xu QF, Cui YH, Li N, Bian XW, Lv SQ. Medulloblastoma stem cells: Promising targets in medulloblastoma therapy. Cancer Sci. 2016;107(5):583–589. doi: 10.1111/cas.12925. [DOI] [PMC free article] [PubMed] [Google Scholar]
- 36.Taylor MD, Northcott PA, Korshunov A, Remke M, Cho YJ, Clifford SC, Eberhart CG, Parsons DW, Rutkowski S, Gajjar A. Molecular subgroups of medulloblastoma: the current consensus. Acta Neuropathol. 2012;123(4):465–472. doi: 10.1007/s00401-011-0922-z. [DOI] [PMC free article] [PubMed] [Google Scholar]
- 37.Northcott PA2, Buchhalter I, Morrissy AS, Hovestadt V, Weischenfeldt J, Ehrenberger T, Gröbner S, Segura-Wang M, Zichner T, Rudneva VA. The whole-genome landscape of medulloblastoma subtypes. Nature. 2017;547(7663):311–317. doi: 10.1038/nature22973. [DOI] [PMC free article] [PubMed] [Google Scholar]
- 38.Werner EA, Deluca HF. Retinoic acid is detected at relatively high levels in the CNS of adult rats. Am J Physiol Endocrinol Metab. 2002;282(3):E672–E678. doi: 10.1152/ajpendo.00280.2001. [DOI] [PubMed] [Google Scholar]
- 39.Infante P, Alfonsi R, Ingallina C, Quaglio D, Ghirga F, D’Acquarica I, Bernardi F, Di Magno L, Canettieri G, Screpanti I. Inhibition of Hedgehog-dependent tumors and cancer stem cells by a newly identified naturally occurring chemotype. Cell Death Dis. 2016;7(9):e2376. doi: 10.1038/cddis.2016.195. [DOI] [PMC free article] [PubMed] [Google Scholar]
- 40.Bassani B, Bartolini D, Pagani A, Principi E, Zollo M, Noonan DM, Albini A, Bruno A. Fenretinide (4-HPR) targets caspase-9, ERK 1/2 and the Wnt3a/ß-Catenin pathway in medulloblastoma cells and medulloblastoma cell spheroids. PLoS One. 2016;11(7) doi: 10.1371/journal.pone.0154111. [DOI] [PMC free article] [PubMed] [Google Scholar]
- 41.Singh AR, Joshi S, Zulcic M, Alcaraz M, Garlich JR, Morales GA, Cho YJ, Bao L, Levy ML, Newbury R. PI-3K inhibitors preferentially target CD15+ cancer stem cell population in SHH driven medulloblastoma. PLoS One. 2016;11(3) doi: 10.1371/journal.pone.0150836. [DOI] [PMC free article] [PubMed] [Google Scholar]
- 42.Moreb JS, Ucar-Bilyeu DA, Khan A. Use of retinoic acid/aldehyde dehydrogenase pathway as potential targeted therapy against cancer stem cells. Cancer Chemother Pharmacol. 2017;79(2):295–301. doi: 10.1007/s00280-016-3213-5. [DOI] [PubMed] [Google Scholar]
- 43.Gumireddy K, Sutton LN, Phillips PC, Reddy CD. All-trans-retinoic acid-induced apoptosis in human medulloblastoma: activation of caspase-3/poly(ADP-ribose) polymerase 1 pathway. Clin Cancer Res. 2003;9(11):4052–4059. [PubMed] [Google Scholar]
- 44.Chang Q, Chen Z, You J, McNutt MA, Zhang T, Han Z, Zhang X, Gong E, Gu J. All-trans-retinoic acid induces cell growth arrest in a human medulloblastoma cell line. J Neuro-Oncol. 2007;84(3):263–267. doi: 10.1007/s11060-007-9380-9. [DOI] [PubMed] [Google Scholar]
- 45.Chen J, Cao X, An Q, Zhang Y, Li K, Yao W, Shi F, Pan Y, Jia Q, Zhou W. Inhibition of cancer stem cell like cells by a synthetic retinoid. Nat Commun. 2018;9(1):1406. doi: 10.1038/s41467-018-03877-7. [DOI] [PMC free article] [PubMed] [Google Scholar]
- 46.Bahmad HF, Samman H, Monzer A, Hadadeh O, Cheaito K, Abdel-Samad R, Hayar B, Pisano C, Msheik H, Liu YN. The synthetic retinoid ST1926 attenuates prostate cancer growth and potentially targets prostate cancer stem-like cells. Mol Carcinog. 2019;58(7):1208–1220. doi: 10.1002/mc.23004. [DOI] [PubMed] [Google Scholar]