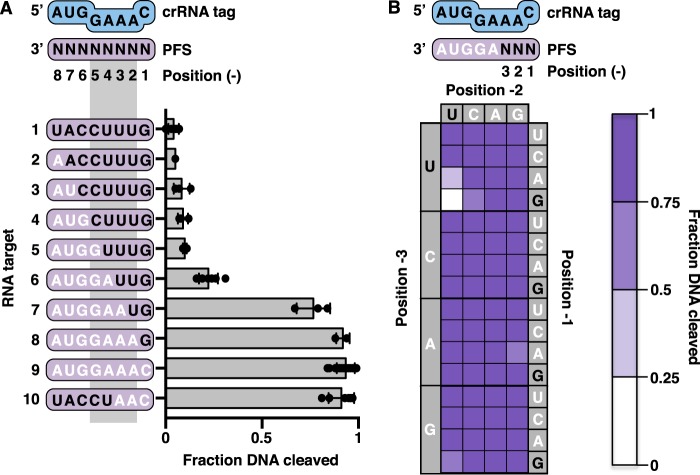
Figure 2.
Importance of positions −1 to −3 of the PFS in invader host transcript discrimination. A, scatter plots showing the fraction of DNA cleaved by the TmaCmr complex when activated by RNA targets with varying amounts of anti-tag sequence in the PFS. Black letters indicate positions of anti-tag sequence. Individual values are plotted as solid black circles. Bar chart represents the mean of these values. Independent experiments were repeated at least three times. Error bars are S.D. B, heat map of normalized TmaCmr DNA cleavage upon activation with RNA targets with all sequences in positions −1 to −3 of the PFS. All targets contain the noncomplementary sequence, AGGUA, in positions −4 to −8 of the PFS. Dark purple indicates a high level of activation, whereas white indicates low activation. Individual plots of these data are shown in Fig. S4. Values shown are the average of at least three replicates.

