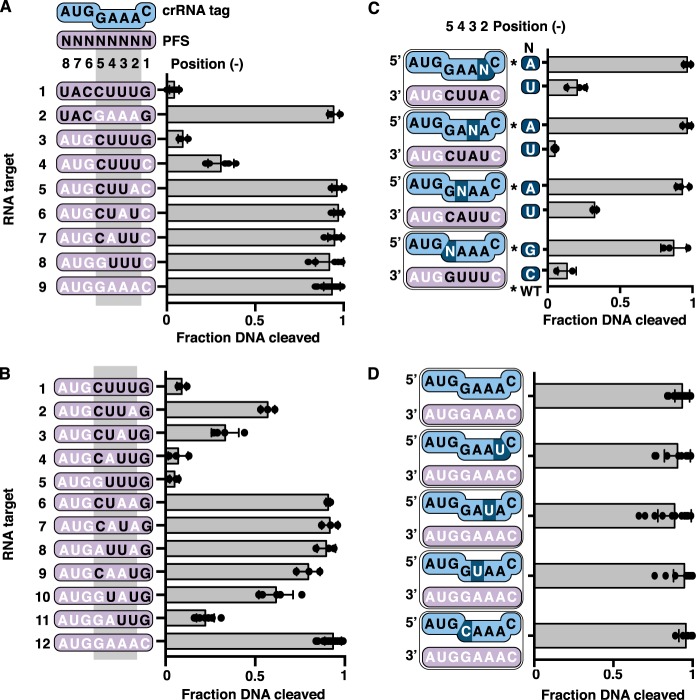
Figure 4.
Role of PFS positions −2 to −5 in distinguishing invader and host transcripts. A and B, scatter plots of the fraction of DNA cleaved by the TmaCmr complex when activated by RNA targets with varying amounts of anti-tag sequence in positions −1 to −5. C, scatter plots of normalized fraction of DNA cleaved by the TmaCmr complex. RNA targets with anti-tag sequence in three of four positions from −2 to −5 were paired with WT crRNA or a crRNA mutated such that the target gained full complementarity in this region. Black letters indicate positions of anti-tag sequence. Individual values are plotted as solid black circles. Bar chart represents the mean of these values. Independent experiments were repeated at least three times. Error bars are S.D. D, scatter plots of fraction DNA cleaved by the TmaCmr complex programmed with mutant crRNA.

