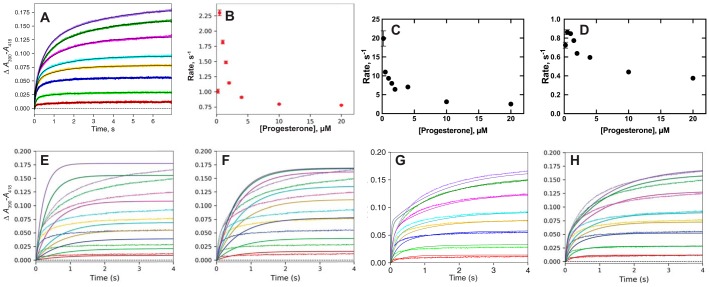
Figure 4.
Binding of progesterone to P450 17A1. Data are from Ref. 28. The final P450 concentration was 1 μm; the final progesterone concentrations were 0.2, 0.5, 1.0, 1.5, 2, 4, 10, and 20 μm; and the time period was 7 s. A, double-exponential fits of the data curves. B, plot of the single-exponential rates from the data in A versus progesterone concentration. C, plot of the faster phase biexponential rates from A versus progesterone concentration. D, plot of the slower phase biexponential rates from A versus progesterone concentration. E–H, modeling of binding of progesterone to P450 17A1 (28). The colors of the fitted lines match the data sets. E, induced-fit model 1, developed to balance initial rates at higher substrate concentrations: k1 = 3.0 × 10⁶ m−1 s−1, k−1 = 100 s−1, k2 = 10 s−1, k−2 = 0.85 s−1 (ϵ390–418 55 mm−1 cm−1). F, induced-fit model 2, developed to balance amplitudes at lower progesterone concentrations: k1 = 100 × 106 m−1 s−1, k−1 = 50 s−1, k2 = 1.4 s−1, k−2 = 0.38 s−1 (ϵ390–418 55 mm−1 cm−1). G, conformational selection model: k1 = 0.91 s−1, k−1 = 1.2 s−1, k2 = 1.3 × 10⁶ m−1 s−1, k−2 = 1.6 s−1 (ϵ390–418 = 45 mm−1 cm−1). H, combined conformational selection/induced-fit model: k1 = 0.80 s−1, k−1 = 1.1 s−1, k2 = 12 × 106 m−1 s−1, k−2 = 34 s−1, k3 = 24 s−1, k−3 = 2.7 s−1 (ϵ390–418 = 50 mm−1 cm−1).

