Figure 5.
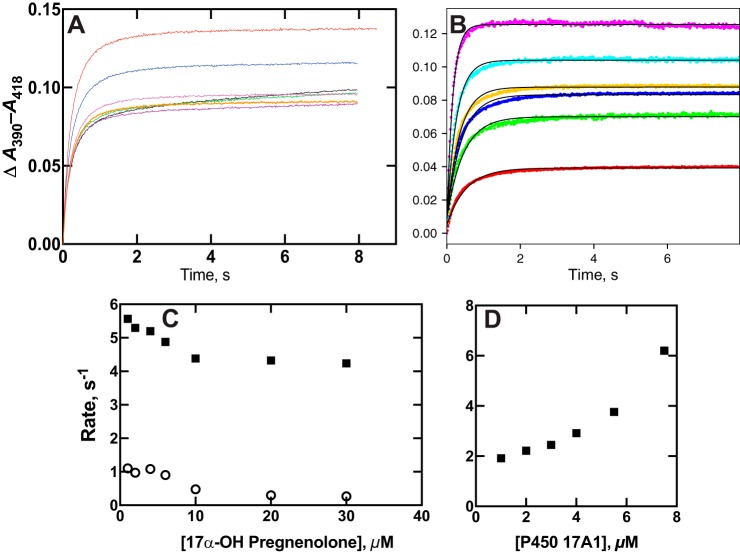
Comparisons of changes in rates of P450 17A1–17α-OH pregnenolone binding by varying the individual components. A, ΔA390 − A418 traces observed by mixing 2 μm P450 17A1 with varying concentrations of 17α-OH pregnenolone (0.2, 0.5, 1.0, 1.5, 2, 4, 10, and 20 μm; data the same as presented in Fig. 6A). B, ΔA390 − A418 traces obtained after mixing 2 μm 17α-OH pregnenolone with varying concentrations of P450 17A1 (2, 4, 6, 8, 11, and 15 μm), with amplitude increasing with concentration. The data are fit with single-exponential rates. C, plots of the fast (■) and slow (○) rates from a biexponential fit of the data in A. D, plot of the rates of the single-exponential fits of the data of B. The calculated errors (S.D.) are within the sizes of the points in C and D.

