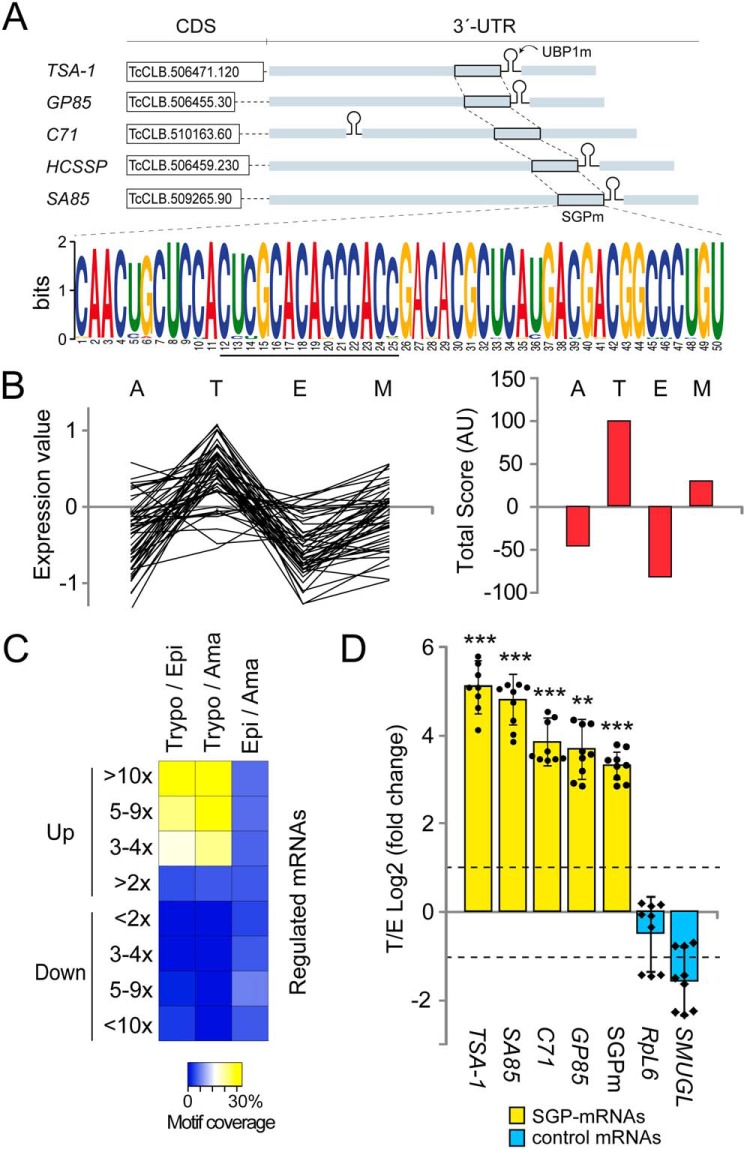
Figure 1.
Members of the TcS family containing a highly conserved sequence in their 3′-UTRs are over-represented in the infective trypomastigote stage of the parasite. A, a 50-nt-long conserved sequence within the 3′-UTR of TS-like subfamily members, called SGPm detected by the MEME tool. SGPm is present in 83% of the TS-like subfamily members (input: 59 sequences). B, summary of microarray analysis of 70 genes with the SGPm. The relative mRNA levels in the four developmental stages were obtained from TriTrypDB (left chart). The life cycle stage with the highest mRNA level was assigned score 2, the one with the second highest mRNA level was assigned score 1, and those with lower mRNA abundance were assigned scores −1 and −2. The total scores obtained for each stage were then plotted (right chart). M, metacyclic trypomastigotes. C, heat map representation of the percentages of genes having the SGPm in most up- or down-regulated transcripts in pair wise comparisons. Data of genes with >2, 3–4, 5–9, or >10-fold change differences were extracted from Li et al. (16). Trypo/Epi, trypomastigote versus epimastigote; Trypo/Ama, trypomastigote versus amastigote; Epi/Ama, epimastigote versus amastigote. The yellow/white color indicates a high correlation, whereas the blue color indicates a low correlation. D, results from RT-qPCR quantification assays showing the enrichment of surface glycoprotein transcripts in infective trypomastigotes over noninfective epimastigotes forms. TSA-1, GP85, SA85, C71, and SGPm are members of the TcS family (yellow bars). SMUGL is a target of TcUBP1 but not a member of TcS family. RPL6 is the ribosomal protein L6 mRNA that is not a TcUBP1 target. The values are expressed as the means ± S.D. of the fold changes in log2 scale from three independent experiments. The individual data points are shown by filled circles (SGP mRNAs) and diamonds (control). Dotted lines indicate a 2-fold change.

