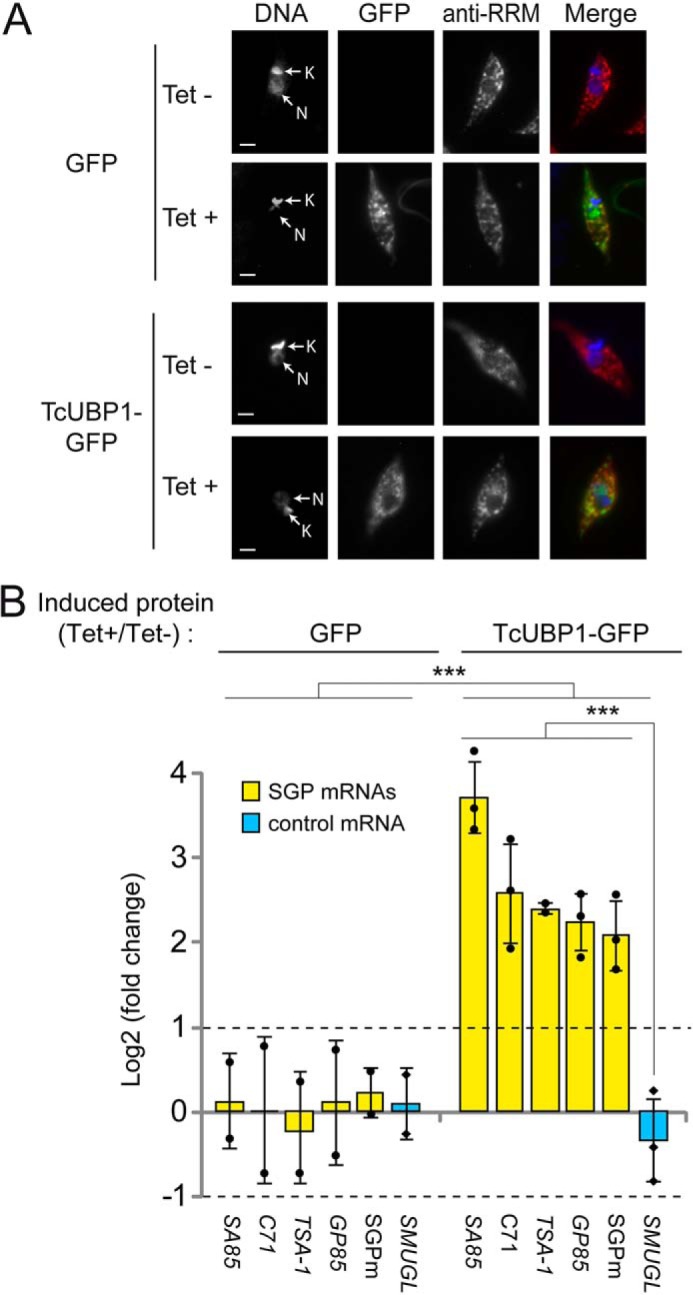
Figure 3.

Levels of transcripts coding for trypomastigote surface glycoprotein in epimastigote parasites overexpressing TcUBP1–GFP. A, representative images of isolated epimastigotes transfected with GFP or TcUBP1–GFP and induced with tetracycline (Tet+) or not (Tet−). Grayscale images of each channel are shown on the left. Merged images showing expression of GFP (in green), TcUBP1 (anti-RRM signal, in red), and DAPI staining (in blue) for visualization of kinetoplast (K) and nuclear (N) DNA are shown on the right. B, RT-qPCR results for transcripts encoding trypomastigote surface glycoproteins (SA85, C71, TSA-1, and GP85), the SGPm element, and the SMUGL transcript coding for epimastigote surface glycoprotein as control. The values are expressed as the means ± S.D. of the fold changes in log2 scale from three independent experiments. The average data points are shown by filled circles (SGP mRNAs) and diamonds (control). ***, p < 0.001; two-way ANOVA with Bonferroni's post hoc test. Dotted lines indicate 2-fold enrichment (upper, log2 FC = 1) or depletion (lower, log2 FC = −1).
