Figure 7.

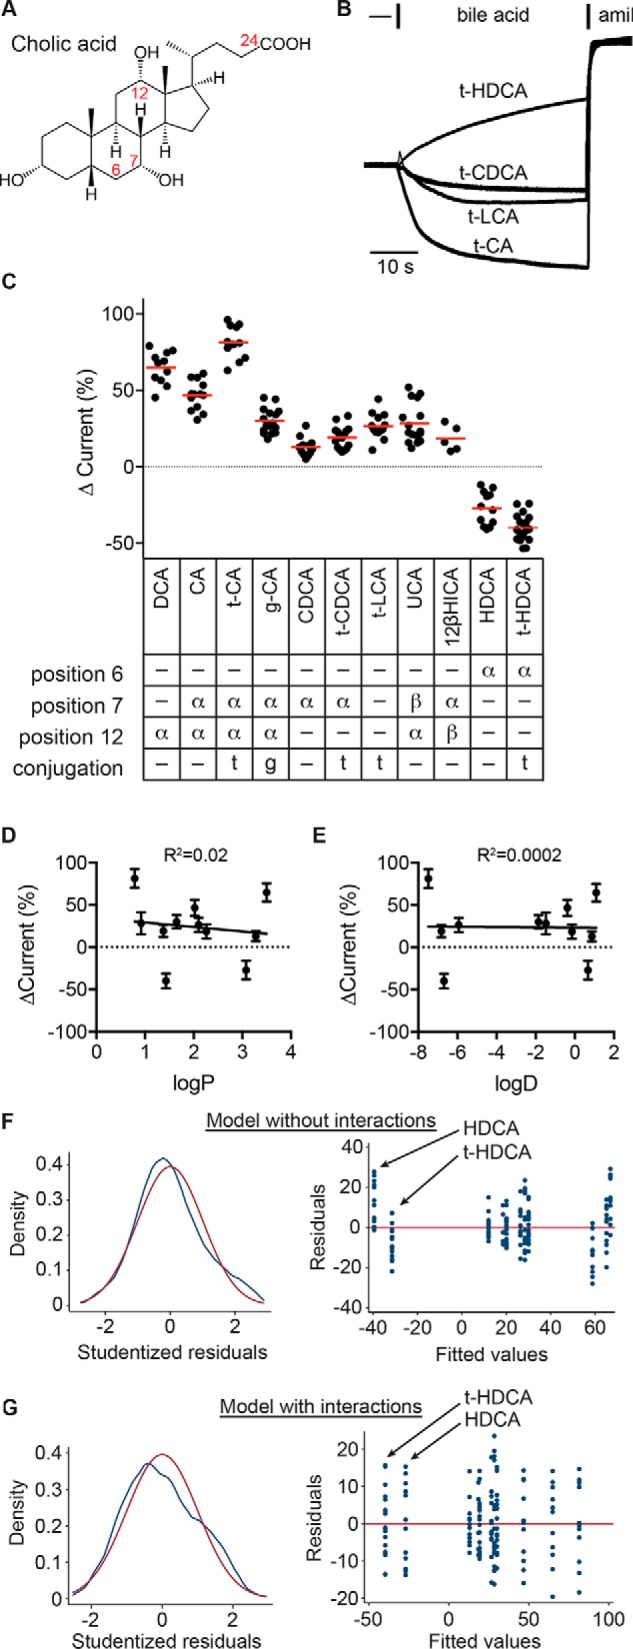
ENaC-activating bile acids possess specific moieties. A, schematic of cholic acid structure. Solid wedges connect groups facing the hydrophobic side of the molecule, termed the β side. Dashed wedges connect groups facing the hydrophilic side of the molecule, termed the α side. Bile acids can be conjugated with taurine or glycine at position 24. B, representative recordings of the effect of various taurine-conjugated bile acids at 1 mm, followed by 10 μm amiloride (amil). C, bile acid–driven changes in current were determined as a percentage of the amiloride-sensitive baseline current. Individual experiments are shown with bars indicating the mean. The position and orientation (facing the α or β side) of hydroxyl groups in the tested bile acids and the presence of taurine or glycine conjugation at position 24 are summarized. All bile acids tested had a 3α-OH. Data were analyzed by one-way ANOVA with Tukey's multiple-comparison test, with results summarized in Table 1. D and E, the effect on ENaC currents for each bile acid was plotted against the bile acid's logP and logD values (see Table 1). Neither correlation was significant. Data were also analyzed by multiple linear regression, with functional groups as independent factors. Models with no interactions between functional groups (F) or with interactions between functional groups (G; see Table 2) were evaluated. F and G (left), kernel density plot of Studentized residuals (blue line) to evaluate distribution of residuals, with normal density (red line) overlaid. Both models gave normally distributed residuals, as determined by the Shapiro–Wilk W test (p = not significant). F and G (right), residuals versus fitted values plot to evaluate heteroscedasticity in models. White's test for heteroscedasticity gave p = 0.0003 for the model without interactions and p = 0.049 for the model with interactions.
