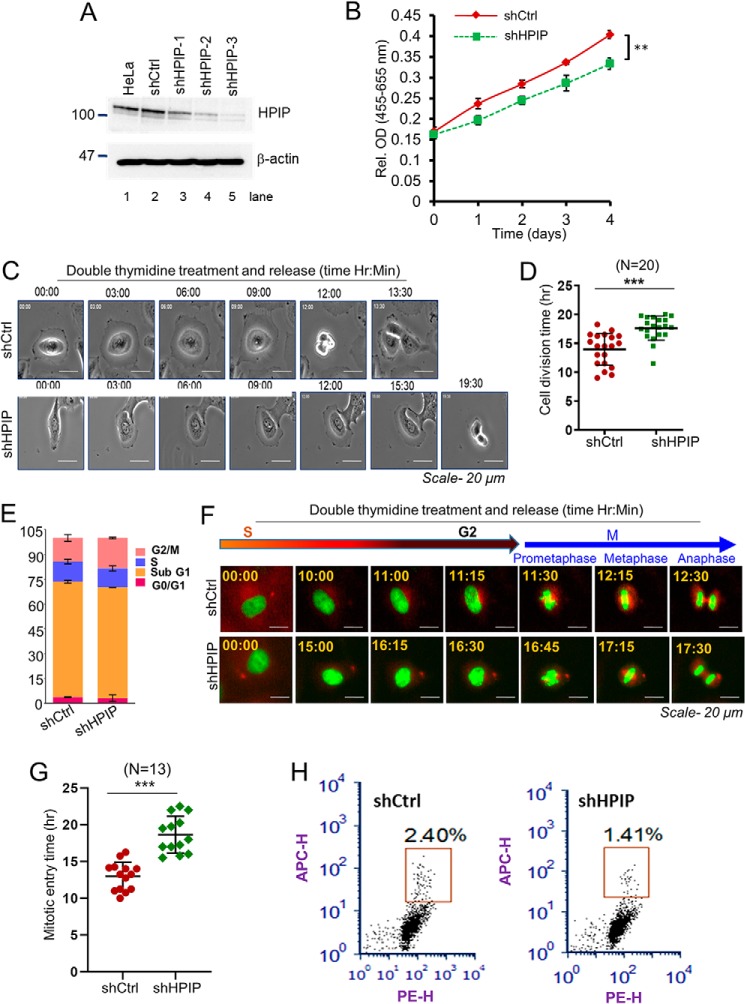
Figure 1.
Loss of HPIP expression delays cell division. A, HPIP knockdown by various HPIP-specific shRNAs (shHPIP-1, shHPIP-2, and shHPIP-3) in HeLa cells was analyzed by Western blotting. B, cell proliferation upon HPIP knockdown in HeLa cells was analyzed by WST-1 assay. C, representative time-lapse live cell images of HPIP-depleted HeLa cells (magnification, 20×). D, quantification data of C. A total of 20 cells were analyzed for each sample (n = 20). E, flow cytometry (FACS) analysis showing HeLa cells at various stages of cell cycle (percentage) upon HPIP knockdown. F, representative time-lapse live cell fluorescent images of either siCtrl or siHPIP-treated HeLa–H2B/tubulin cells that are synchronized by DT block at the S phase followed by release into fresh medium and captured at indicated time points. Green, H2B–EGFP; red, α-Tubulin–mCherry (magnification, 20×). EGFP, enhanced green fluorescence protein. G, quantification data of F. A total of 13 cells were analyzed for each sample (n = 13). H, HeLa cells transfected with either shCtrl or shHPIP were fixed and stained with H3Pho-S10 antibody and propidium iodide and then subjected to flow cytometry analysis. The mitotic cells were boxed. The mitotic indices are indicated as percentages of total cell population. The quantified results are presented as means ± S.D. using Student's t test. **, p < 0.001; ***, p < 0.0001 were considered significant. Ctrl, control; sh, short hairpin; Rel. OD, relative optical density.

