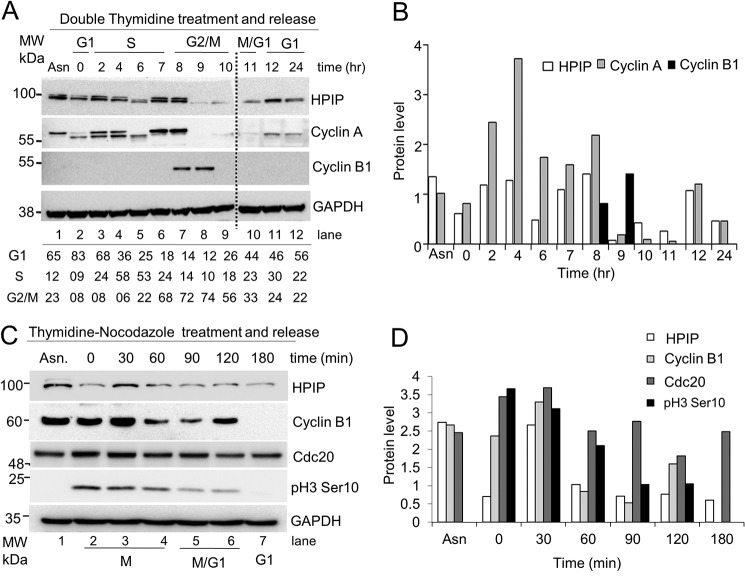
Figure 2.
HPIP protein levels oscillate across the cell cycle progression. A, HeLa cells synchronized by double thymidine block were release into fresh medium. The cells collected at indicated time points were analyzed by Western blotting (upper panel). (Note: Protein samples from lanes 1–9 and 10–12 were run on two different gels.) The percentage of cells at various stages of the cell cycle indicated was derived from FACS analysis (lower panel). B, bar graph showing the quantification of protein bands (relative to glyceraldehyde-3-phosphate dehydrogenas) from A (upper panel). C, HeLa cells synchronized by thymidine–nocodazole block were released into fresh medium at indicated time points, and cell lysates were analyzed by Western blotting. D, bar graph showing the quantification of protein bands (relative to glyceraldehyde-3-phosphate dehydrogenase) from C. Protein band intensities was determined using ImageJ software. MW, molecular weight.

