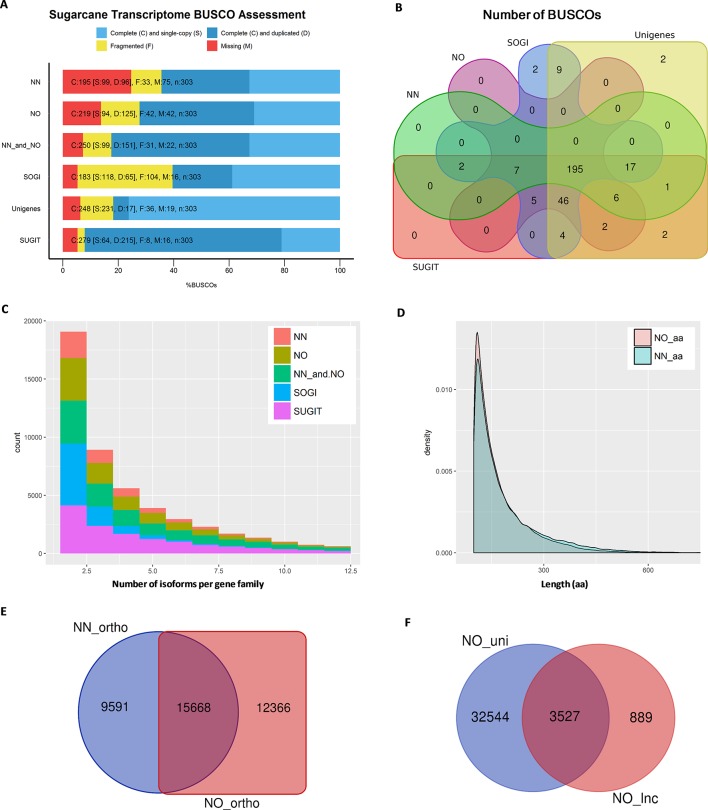
Figure 3.
Transcriptome quality assessment via BUSCO, OrthoMCL, and Cogent packages. (A) BUSCO completeness assessment of two datasets, combined data and three reference transcriptome databases, SoGI, unigenes, and SUGIT. In the bar charts, C, S, D, F, and M denote complete, single, duplicate, fragmented, and missing BUSCOs. (B) Venn diagram showing BUSCOs recovered in each of datasets. (C) Number isoforms per gene family identified by Cogen pipeline. (D) Length distribution of extracted ORF sequences from the two datasets. (E) Venn diagram showing a comparison of orthologous groups between two datasets. (F) Long noncoding transcripts identified in the NO dataset (NO_lnc) compared against the unique fraction of transcripts from the NO dataset (NO_uni). NN, sugarcane non-normalized PacBio Iso-Seq isoforms; NO, sugarcane normalized PacBio Iso-Seq isoforms; SoGI, Saccharum officinarum gene indices; SUGIT, sugarcane Iso-Seq transcriptome; aa denotes amino acid.

