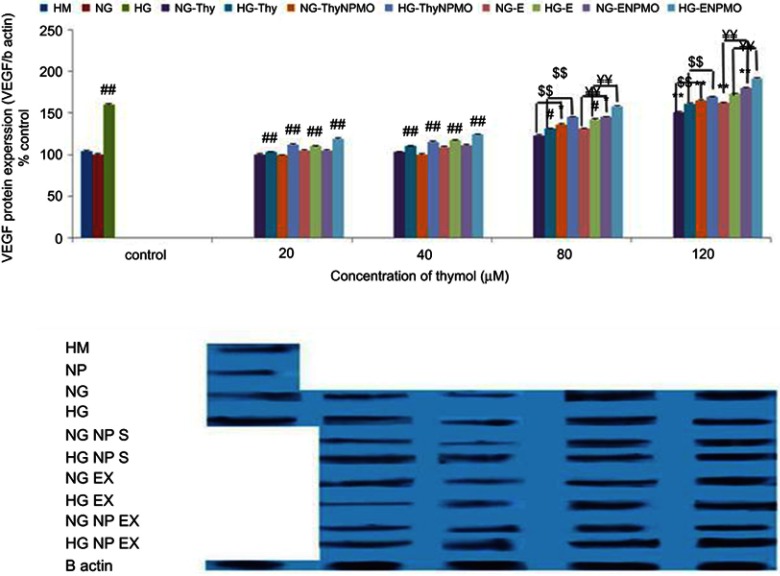
Figure 13.
Effect of Thy, ThyNPMO, E, and ENPMO on VEGF in OECs cell in normal glucose (NG) and high glucose (HG) states. Protein expression of VEGF (%) in olfactory ensheathing cells (OECs) exposed to normal glucose (NG), high glucose (HG), high mannitol (HM), NG plus Thymol (NG-Thy), HG plus Thymol (HG-Thy), NG plus Thymol polymeric nanoparticles modified by oleic acid (NG-ThyNPMO), HG plus Thymol polymeric nanoparticles modified by oleic acid (HG-ThyNPMO), NG plus extract (NG-E), HG plus extract (HG-E), NG plus extract polymeric nanoparticles modified by oleic acid (NG-ENPMO), HG plus extract polymeric nanoparticles modified by oleic acid (HG-ENPMO). Data are expressed as mean±SEM. *p<0.01 vs NG and HM, **p<0.001 vs NG and HM, # # p<0.001 vs HG. $$ p<0.001 thymol vs ThyNPMO, ¥¥ p<0.001 E vs ENPMO.

