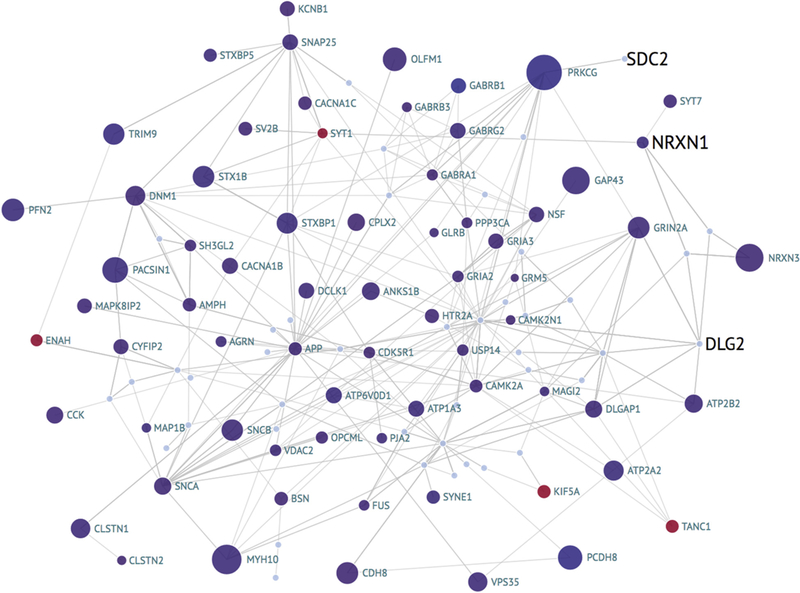
Fig.5.

Network visualization of the synapse genes of the calcineurin pathway with expression and GWAS information. Each bubble is a gene and is colored by direction in differential expression analysis of AD versus normal defined using the composite clinical and neuropathological scores (CpDxLow) in the ROSMAP dorsolateral prefrontal cortex RNA-Seq data; the size indicates significance (-log10 P value). Edges are protein or pathway interactions. The black text labels indicate significance of the locus computed using GWiS from the IGAP meta-analysis; the size indicates the magnitude of the significance. The blue labels are differentially expressed genes without significant GWiS results. GWAS, genome-wide association studies; GWiS, Gene-Wide Significance; AD, Alzheimer’s disease; IGAP, International Genomics of Alzheimer’s Project; ROSMAP, Religious Orders Study and Memory and Aging Project.
