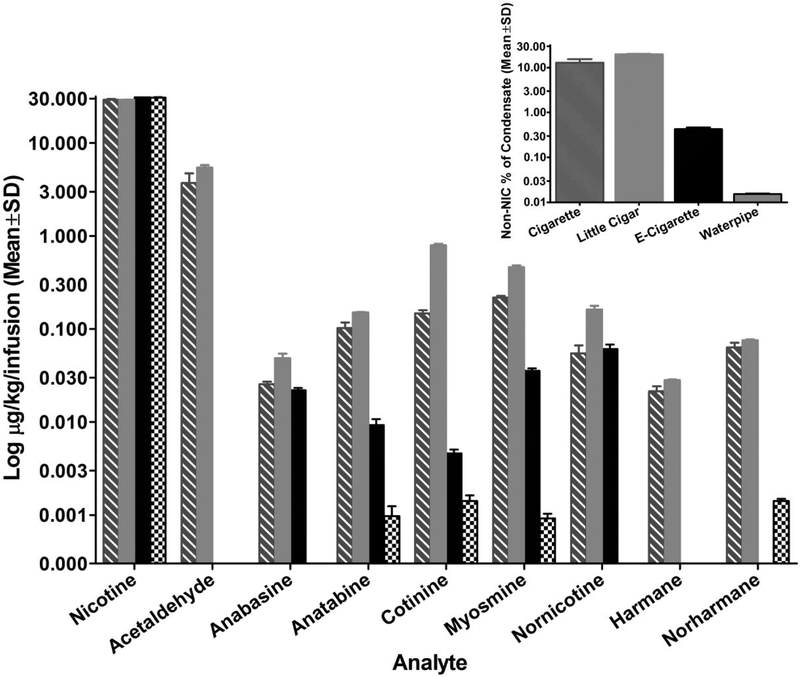
Figure 5.
Concentration of tobacco constituents in each infusion of smoke/aerosol condensate for each tobacco product. Two batches of formulations were created for each tobacco type, and bars show the mean (± SD) of both batches on a log scale. Absence of a bar indicates analyte concentration was below the level of quantitation. Inset: Log concentration of non-nicotine tobacco constituents expressed as a percentage of all analytes (including nicotine) for each smoke/aerosol condensate. NIC=nicotine.

