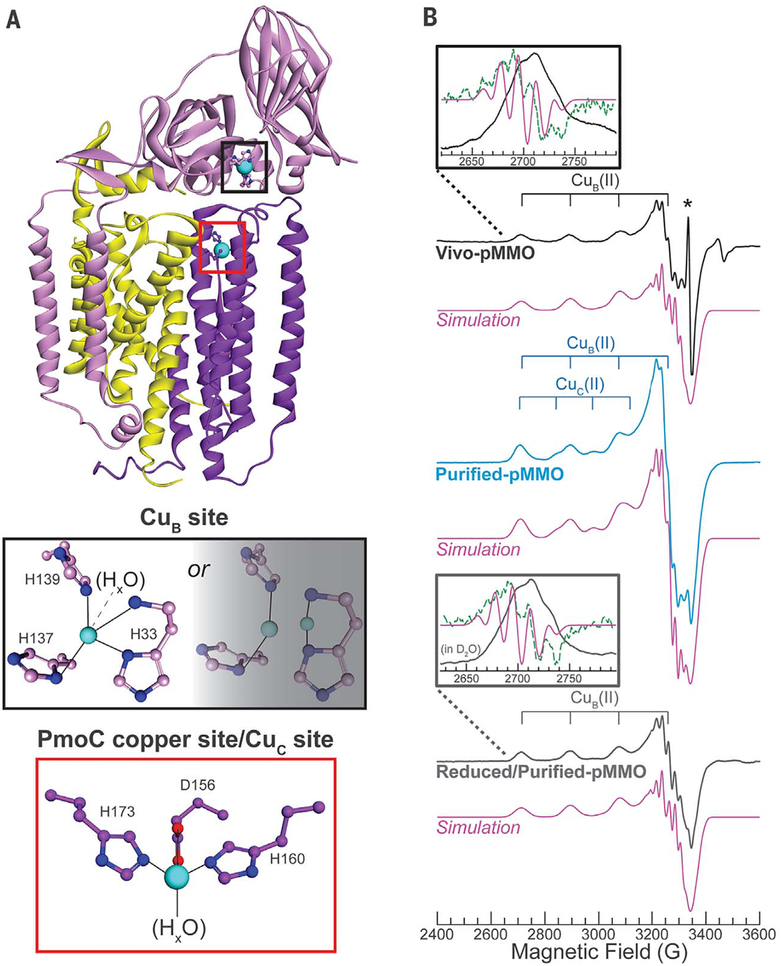
Fig. 1. Structure of one pMMO protomer as well as X-band continuous wave (CW) EPR of Vivo- [showing CuB(II)], Purified-[showing CuB(II) and Cuc(II)], and Reduced/Purified-pMMO [showing CuB(II)].
(A) (Top) Single protomer from the M. capsulatus (Bath) pMMO crystal structure (DOI: 10.2210/pdb3rgb/pdb) (11), showing PmoA (yellow), PmoB (pink), PmoC (purple), Cu (cyan), N (blue), and O (red) atoms. (Middle) The CuB site modeled as monocopper and dicopper. (Bottom) The PmoC metal site, which we have now determined to be the Cuc site, occupied with copper. (B) EPR spectra with simulations of the CuB(II) (Vivo- and Reduced/Purified-pMMO) and CuB(II) plus 0.32 equivalents Cuc(II) (Purified-pMMO) shown below each spectrum. (Insets) Lowest-field Cu hyperfine transition with computed second derivative (green dotted line) and second derivative of the simulation (pink solid line). Asterisk denotes an organic radical species in Vivo-pMMO. This radical is not present in Purified- or Reduced/Purified-pMMO. In the Reduced/Purified-pMMO (inset), the two lowest field 15N hyperfine lines are unresolved, likely because of a small amount of Cuc(II). Spectra and simulation parameters are listed in table S1, and collection conditions are provided in the supplementary materials. Rapid-passage Q-band absorption-display CW EPR spectra are shown in fig. S12. Unless otherwise noted, the concentrations of all EPR/ENDOR samples of Purified- or Reduced/Purified-pMMO were 300 to 500 μM. All pMMO spectra shown in the main text were measured on 63Cu, 15N-labeled pMMO samples.

