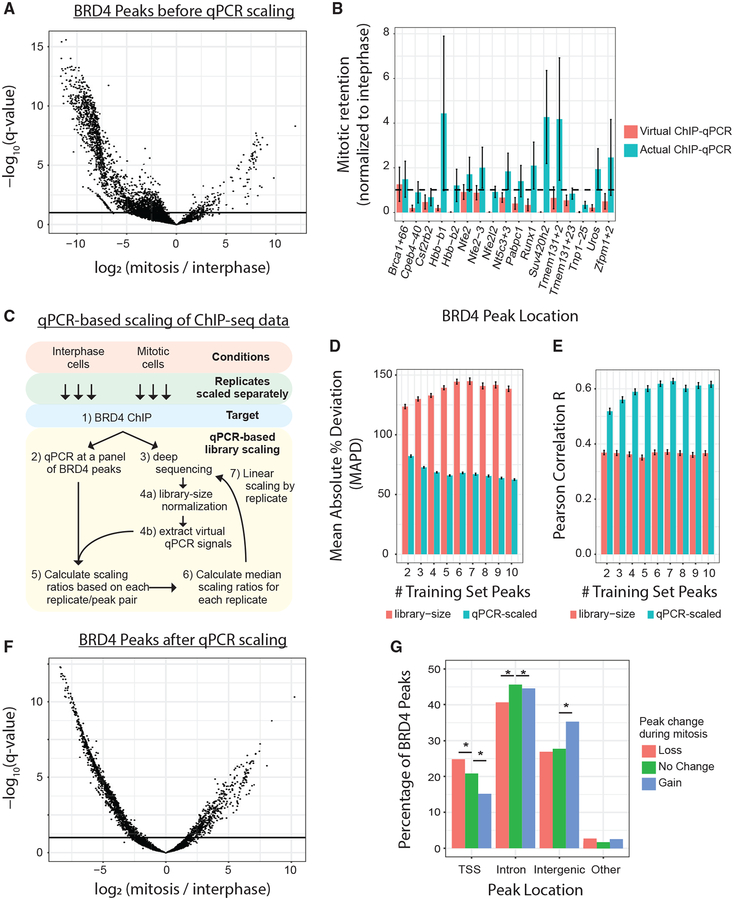
Figure 1. Genome-wide Retention of BRD4 on Mitotic Chromatin.
(A) Significant changes (DESeq2) in BRD4 binding at 5,157 peaks between interphase and mitosis. Binding intensities are scaled by library normalization. Horizontal line is an FDR of 0.1. (B) Mitotic retention of BRD4 binding at 17 interphase BRD4 peaks, measured by ChIP-qPCR versus ChIP-seq (virtual qPCR). Dotted line represents equal interphase and mitotic binding. All peaks are normalized to interphase binding intensity. (C) Schematic describing qPCR-based scaling of ChIP-seq libraries. (D and E) Mean absolute percentage deviation (D) and Pearson correlation coefficient (E) comparing measured ChIP-qPCR intensities with predicted ChIP-qPCR data at out-of-sample BRD4 peaks. Predictions were made with library-normalized ChIP-seq data (red bars) or qPCR-scaled ChIP-seq data (blue bars). (F) Volcano plot displaying significant changes (DESeq2) in BRD4 binding at 5,157 peaks between interphase and mitosis. Binding intensities were scaled by ChIP-qPCR data. Horizontal line is an FDR of 0.1. (G) Percentage of BRD4 peaks, categorized by direction of peak change during mitosis, that are TSS-proximal (−1 kb to +100 bp), intronic, intergenic, or elsewhere. *q < 0.05 by the chi-square test.

