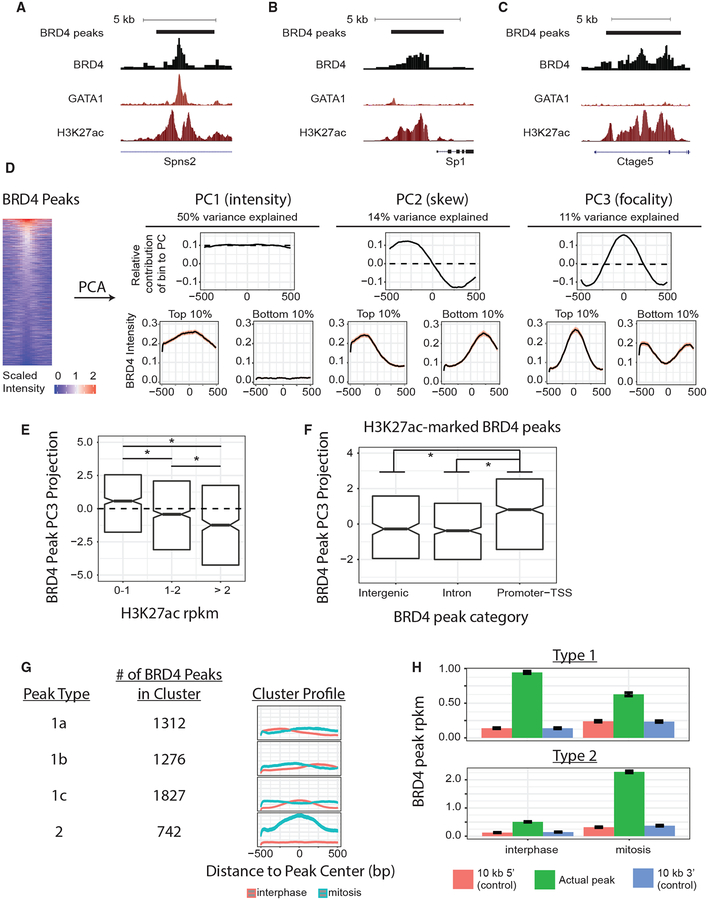
Figure 2. Changes in BRD4 Peak Intensity and Shape during Mitosis.
(A–C) BRD4 peak calls and interphase ChIP-seq tracks for BRD4, GATA1 (Kadauke et al., 2012), and H3K27ac in G1E-ER4 cells at three example loci displaying either GATA1-predominant BRD4 chromatin association (A) or H3K27ac-predominant BRD4 chromatin association (B and C). Tracks for a given factor are scaled identically. (D) PCA on BRD4-scaled binding intensity across 5,157 peaks collected in 10-bp bins yields three PCs (total 75% of variance explained), whose eigenvectors (contributions of bin locations to each PC) are displayed in the top row. Dotted line shows mean bin-coefficient value for that PC. Bottom row shows BRD4 peak profiles (means ± 95% confidence interval [CI]) for peaks within the top or bottom 10% of peak-projection value onto the top three PCs. Heat map shows peak intensities (peak center ± 500 bp) during interphase in descending order of mean intensity in the central 200 bp. (E and F) BRD4 peak projections onto PC3 (focality) categorized by co-occupancy by GATA1 and/or H3K27ac (E). H3K27ac-bound BRD4 peaks, categorized by peak location (F). Box plot center is the median PC3 value, and hinges are 25% and 75% percentiles, *q < 0.001 by Benjamini-Hochberg (BH)-corrected Wilcoxon test. (G) K-means clustering of all BRD4 peaks based on changes in peak PC1, PC2, and PC3 between interphase and mitosis. Profiles show cluster intensity means ± 95% CI. (H) Brd4 intensity (means ± SEM) at type 1 and type 2 peaks (green) during interphase or mitosis compared with Brd4 intensity at matched control regions located 10-kb 5′ (red) or 10-kb 3′ (blue) to the peak center.

