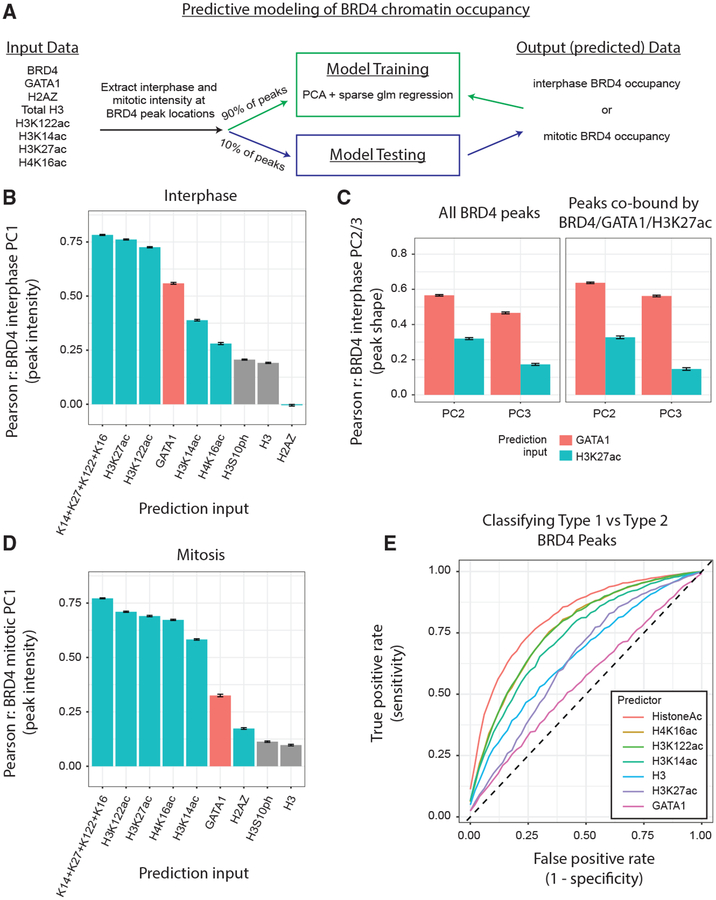
Figure 7. Histone Acetylation Predicts BRD4 Occupancy on Mitotic Chromatin.
(A) Pipeline for testing the ability of chromatin features to predict BRD4 chromatin occupancy. (B) Pearson correlation coefficient (PCC) between the predictions of BRD4 peak PC1 (intensity) projections and actual BRD4 peak PC1 projections during interphase. Prediction inputs (interphase data only) on the x-axis. Means ± SEM (C) PCC between the predictions of BRD4 peak shape features (PC2 and PC3 projections) and actual BRD4 peak shape features during interphase. Prediction inputs (interphase data only) are GATA1 versus H3K27ac. Means ± SEM, *p < 1e−4. (Left) All BRD4 peaks. (Right) Only peaks co-bound by all of BRD4/GATA1/H3K27ac. (D) PCC between the predictions and of BRD4 peak PC1 (intensity) projections and actual BRD4 peak PC1 projections during mitosis. Prediction inputs (mitosis data only) on the x axis. Means ± SEM. (Left) All BRD4 peaks. (Right) Only type 2 BRD4 peaks. (E) Receiver operating characteristic (ROC) curves for the classification of BRD4 peaks as type 1 versus type 2. Prediction inputs colored in legend, and the curves are means of independent runs.

