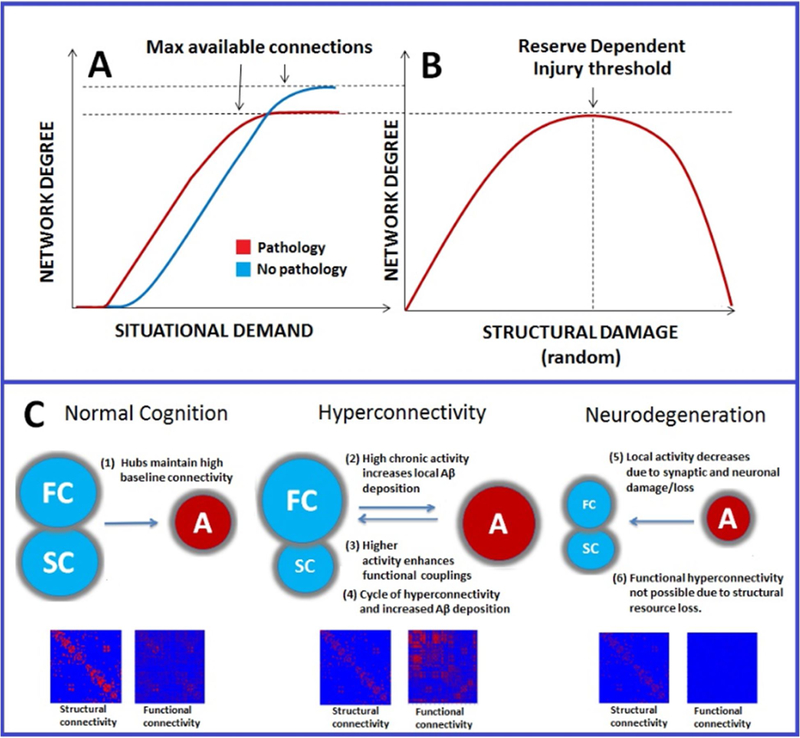
Figure 2.

Schematic representation of interaction between structural and functional connectivity after neurological disruption
Schematic representation of proposed functional connectivity effects in neurological disorder. In panel 2A, the red slope represents earlier connectivity recruitment based upon situational demand (e.g., task load, fatigue). Increased connectivity occurs at a lower situational demand after neurological insult and reaches asymptote at a lower resource threshold compared to the noninjured system (blue). In panel 2B, increased connectivity rises to some critical injury threshold (determined by genetics and environmental enrichment) after which widespread disconnection occurs. Adapted from Hillary et al., 2015 with permission by author; Neuropsychology. Fig 2C: Proposed relationship between increased metabolism in hubs and beta-amyloid deposition (adapted from de Haan et al., 2012; PLoS Comput Biol with permission by author). Hubs have a higher intrinsic activity, making them most susceptible to pathology. In stage two hyperconnectivity results from higher local activity initiating a cycle of beta amyloid deposition and enhanced activity/connectivity. In stage three, hyperconnectivity gives way to connectivity loss at critical resource threshold resulting in neurodegeneration. Abbreviations: FC=functional connectivity, SC=structural connectivity, A=activity, PIB= 11C-PIB.
