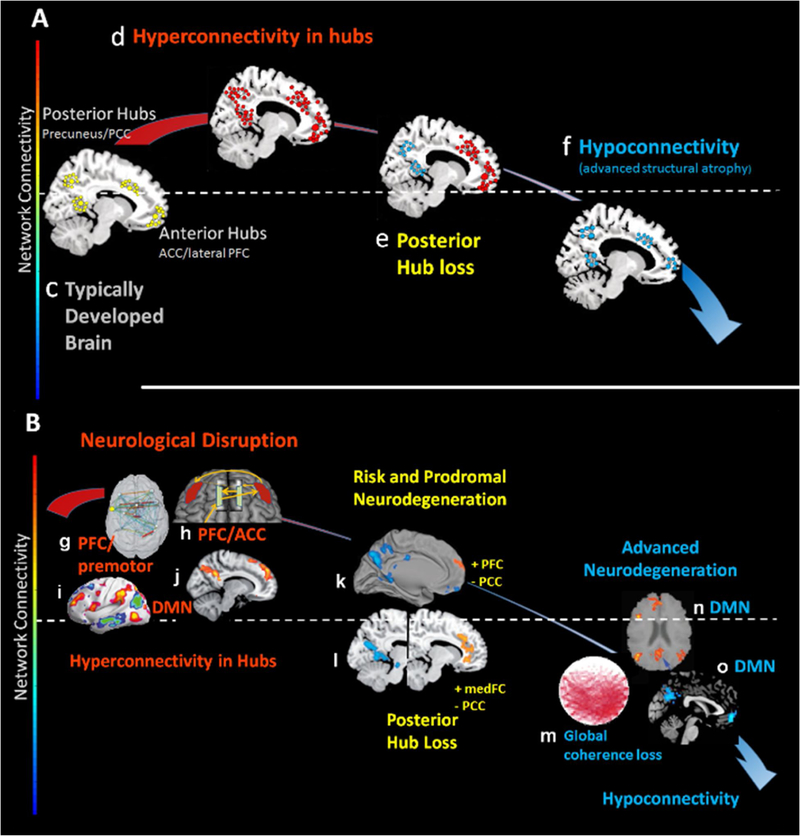
Figure 3 (Key Figure). Centralized Hyperconnectivity Response and Resource Gradients.

Figure 3A: Schematic representation of the hubs commonly demonstrated hyperconnectivity in injury and disease and the structural resource-dependent trajectory from hyper-to hypo-connectivity. 3B: Mirrors the schematic in 3A with evidence from seminal studies in the literature. Findings in 3B: g: brain injury results in increased prefrontal and motor connectivity[133]; h: increased frontal connectivity during task engagement in brain injury [54], i: increased connectivity in DMN hubs in multiple sclerosis [44]; j: increased connectivity in PCC and medial frontal regions of the DMN in TBI [52]; k: increased Aβ predicts increased frontal connectivity in context of posterior connectivity in healthy aging [134]; l: increased medial frontal connectivity with loss in PCC connectivity in AD [135], m: global interhemispheric connectivity loss in AD [136], n: connection loss in PCC connectivity in AD[137] and o: anterior and posterior connectivity loss in AD[138].
