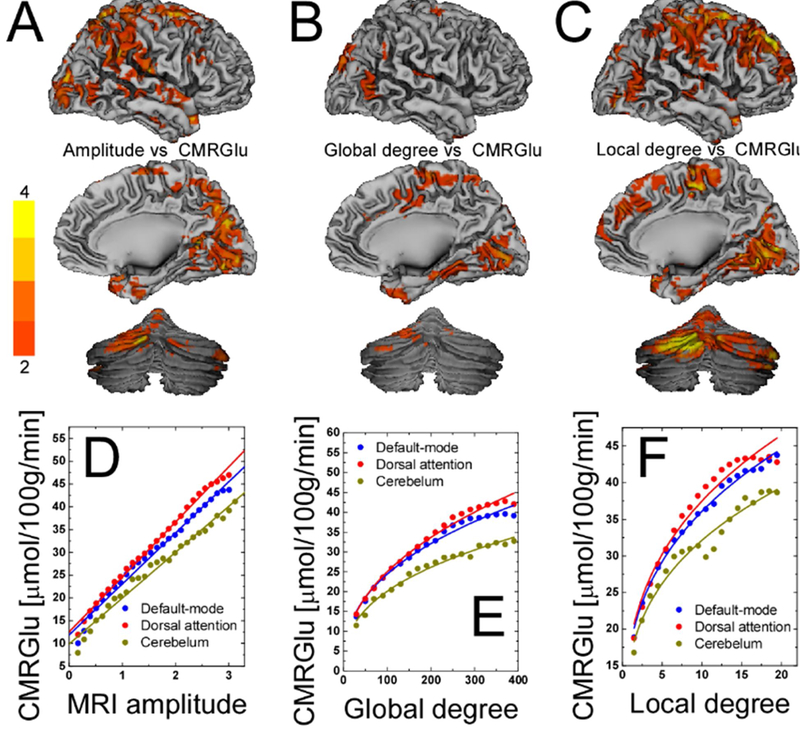
Figure 5. Relationship between connectivity results using fMRI and glucose metabolism.

Statistical maps of the voxelwise correlations between (A) CMRGlu and R-fMRI signal amplitude and between CMRGlu and (C) global and (D) local degree across 54 healthy subjects, superimposed on surface views of the cerebral cortex (medial and lateral) and the posterior cerebellum. The color bars indicate t-score values. Scatter plots exemplifying the linear association between CMRGlu and R-fMRI signal amplitudes (D) and the power scaling of CMRGlu and degree (E and F) across 54 healthy subjects for three different networks. The color lines are reduced-major axis regression fits to the data (0.96 < R2 < 0.99). Figure adapted with permission from Tomasi et al., 2013; PNAS.
