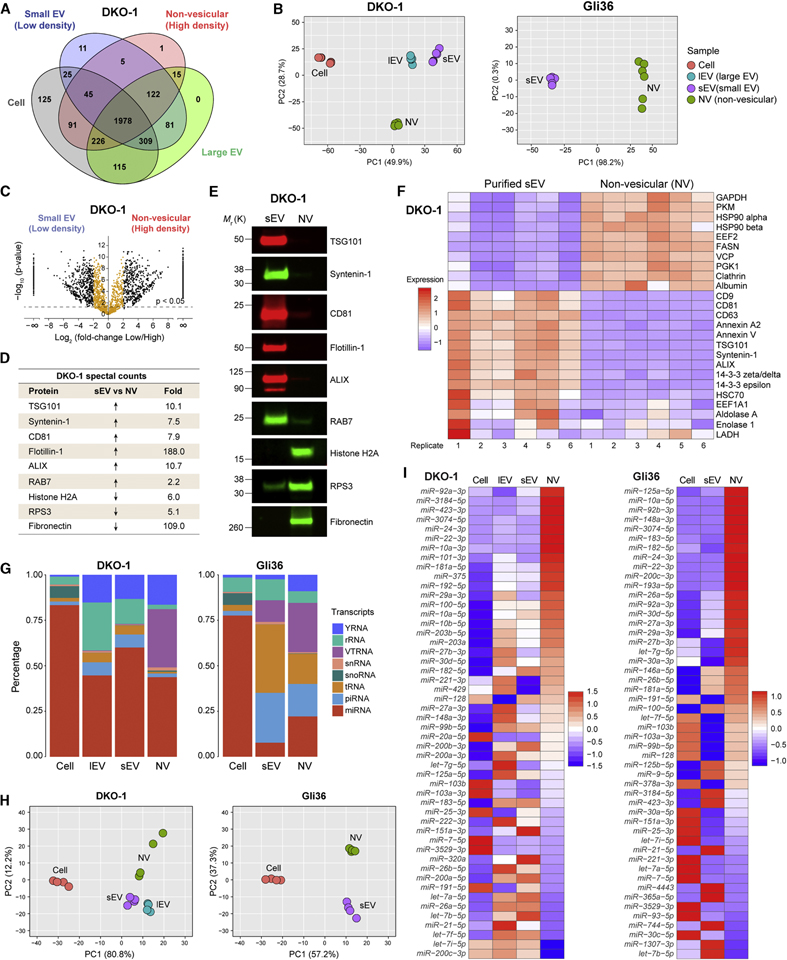
Figure 2. Differential Expression of Protein and RNA in Small Extracellular Vesicles and Non-Vesicular Fractions.
(A) Venn diagram representing the number of unique and overlapping proteins .
(B) Principal Component Analysis of the quantitative differences in spectral counts.
(C) Volcano plots of quantitative differences in proteins in sEV and NV fractions for DKO-1 samples. Black dots represent a four-fold or greater enrichment while orange dots represent less than four-fold enrichment. Dots above the dashed line represent proteins for which differences were significant (FDR < 0.05).
(D) Table of fold-change in spectral counts from proteomic profiling between sEV and NV pooled fractions for selected proteins chosen for validation by immunoblotting.
(E) Immunoblot validation of proteomic profiling. NV, non-vesicular; sEV, small EV.
(F) Heatmap of the 25 most commonly identified exosomal proteins from the ExoCarta exosome database form proteomic profiling of sEV and NV from DKO-1. Scale indicates intensity, defined as Δ(spectral counts – mean spectral counts)/standard deviation.
(G) Percentage of short RNA reads mapping to different types of small ncRNA for cellular and extracellular DKO-1 (left) and Gli36 (right) samples.
(H) Principal Component Analysis based on quantitative miRNA profiles.
(I) Heat map of the 50 most abundant miRNAs across all sample types. Scale indicates intensity, defined as Δ(read counts – mean read count)/standard deviation.

