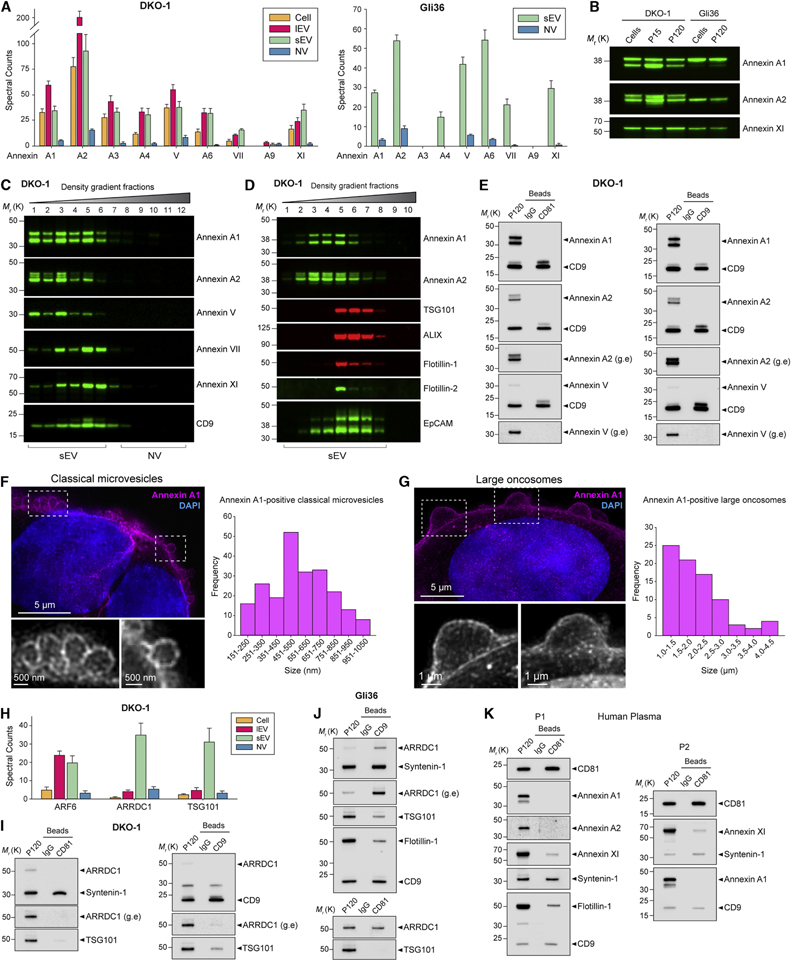
Figure 5. Annexin A1 is a Novel and Specific Marker of Microvesicles Distinct from Exosomes and ARMMs.
(A) Proteomic analysis of extracellular Annexins. (Left) Spectral counts for Annexins for cells, lEVs (P15) and gradient-purified sEV and NV samples for DKO-1, and (Right) for gradient-purified sEV and NV samples for Gli36. Data represent mean ± SD. n = 6.
(B) Immunoblot analysis of Annexin expression in cells, lEVs (P15), and crude sEVs (P120).
(C) High-resolution (12–36%) density fractionation of crude DKO-1 sEVs (P120).
(D) Gradient (6–30%) density fractionation of crude DKO-1 sEVs (P120).
(E) DIC of CD81-and CD9-positive exosomes from DKO-1 cells. Immunoblots of crude sEV pellet (P120) and bead-captured exosomes. g.e, greater exposure.
(F) Annexin A1-positive classical microvesicles. (Left) 3D Structured Illumination Microscopy (SIM) of DKO-1 cells stained for Annexin A1 and DAPI. Enlarged inserts displayed in greyscale at the bottom. (Right) Size distribution of Annexin A1-positive classical microvesicles imaged by 3D SIM of DKO-1 cells. Histogram of maximum width of vesicles shed at the plasma membrane. n = 221; data from four independent experiments.
(G) Annexin A1-positive large oncosomes. (Left) 3D SIM of DKO-1 cells stained for Annexin A1 and DAPI. Enlarged inserts displayed in greyscale at the bottom. (Right) Size distribution of Annexin A1-positive classical large oncosomes imaged by 3D SIM of DKO-1 cells. Histogram of maximum width of large oncosomes blebbing at the plasma membrane. n = 82; data from four independent experiments.
(H) Proteomic analysis of ARF6, ARRDC1 and TSG101 present in DKO-1 cells, lEV (P15), density gradient-purified sEV and NV fraction pools. Data are mean ± SD. n = 6.
(I-K) DIC of CD81-and CD9-positive exosomes from (I) DKO-1, (J) Gli36, and (K) human plasma. g.e, greater exposure.
See also Figure S5.

