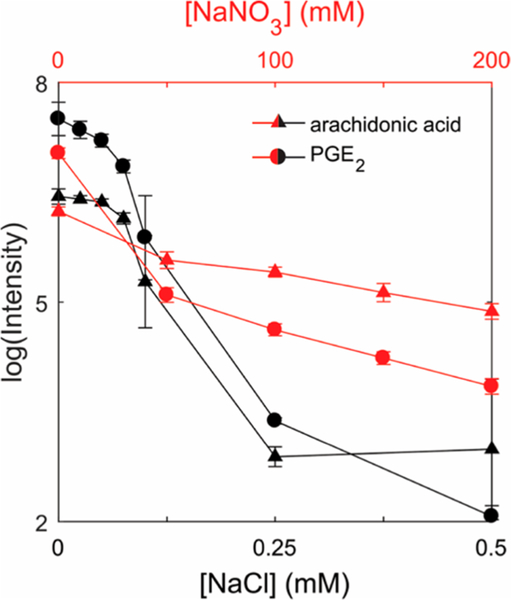
Figure 2.
Effect of salts on the formation of silver cationization. Note that the different concentrations for each respective salt are displayed on both x axes ([NaNO3] is displayed on the top x axis and the [NaCl] is set as the bottom axis). The concentration of PGE2 (m/z 461.1300) and arachidonic acid (m/z 411.1453) was 1 μM in all solutions. Each error bar represents the standard deviation for n = 5 measurements.

