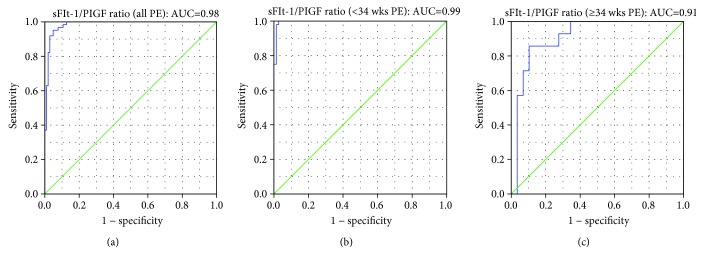
Figure 2.
ROC curves for PE diagnosis. Receiver operating characteristic (ROC) curves of the sFlt-1/PlGF ratio were constructed in all PE (AUC = 0.98, 95% CI, 0.969-1.000), early onset PE (AUC = 0.99, 95% CI, 0.989-1.000), and late onset PE (AUC = 0.91, 95% CI, 0.822-1.000). When cutoff of 21.5 was used, the NPV for the diagnosis of PE was 97.9%, 100%, and 91.7% for all, early onset, and late onset PE. When cutoff of 97.2 was used, the PPV for the diagnosis of PE was 97.5%, 100%, and 75.0% for all, early onset, and late onset PE.

