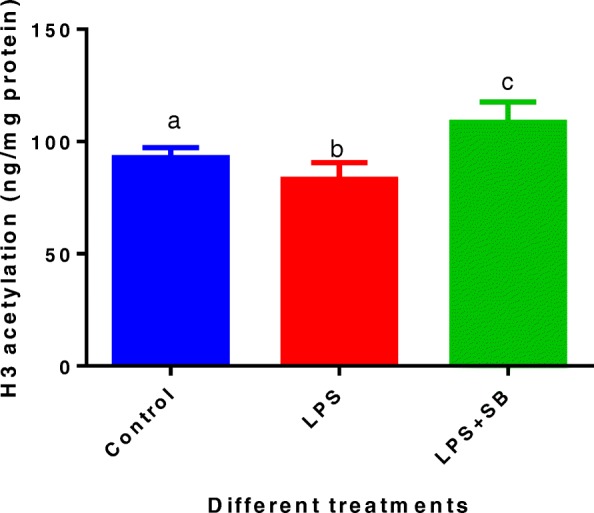
Fig. 3.

Acetylation of histone H3 in MAC-T bovine mammary epithelial cells among different treatments for 48 h: control, lipopolysaccharide (LPS, 100 EU/mL), and LPS (100 EU/mL) plus sodium butyrate (SB, 10 mmol/L). Data represent the mean and standard deviation (n = 6/treatment) and columns with different letters (a,b,c) indicate significant differences in histone H3 acetylation levels across treatments (P < 0.05). The raw data were shown in Additional file 3: Table S3
