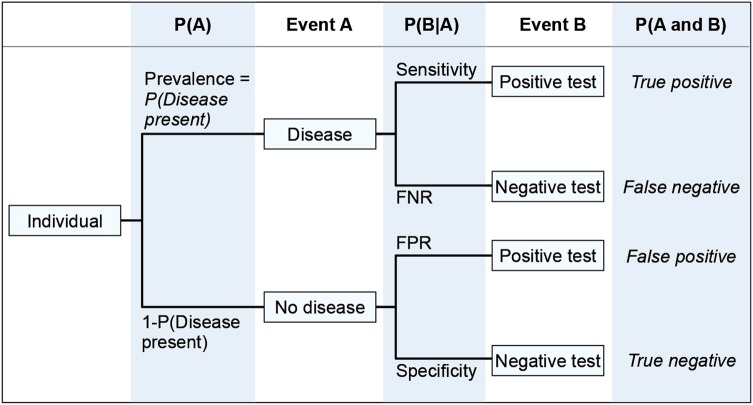
Fig. 1.
Tree diagram representing all possible outcomes of a diagnostic test. P(A) is the probability of Event A. P(B|A) is the conditional probability of Event B given Event A. FPR is the false positive rate = P(Positive test | Disease absent). FNR is the False negative rate = P(Negative test | Disease present).

