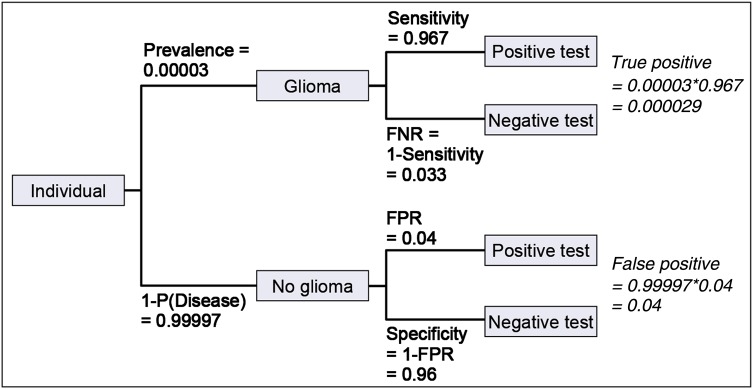
Fig. 2.
Tree diagram representing all possible outcomes and condition probabilities given in hypothetical diagnostic test example. Text in bold is given in example. Text in italic is calculated from given information in bold. FPR is the false positive rate = P(Positive test | Disease absent). FNR is the False negative rate = P(Negative test | Disease present).

