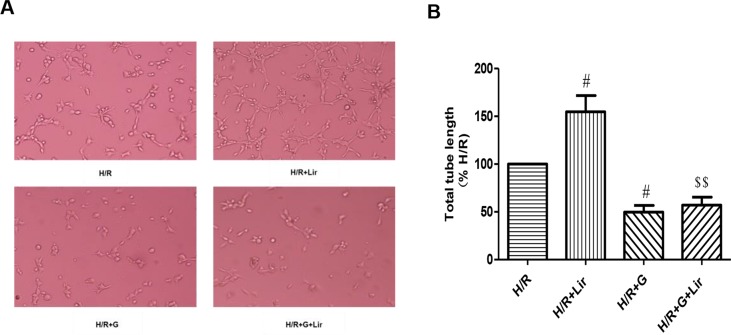
Figure 2.
Effect of Lir on the tube formation after H/R injury in HUVECs at different time points. Bar graph of tube formation assessment with different times of Lir. Data were analyzed as tube percentage versus control group. #P < 0.05, ##P < 0.01 compared to H/R group; $P < 0.05, $$P < 0.01 compared to H/R+Lir group.

