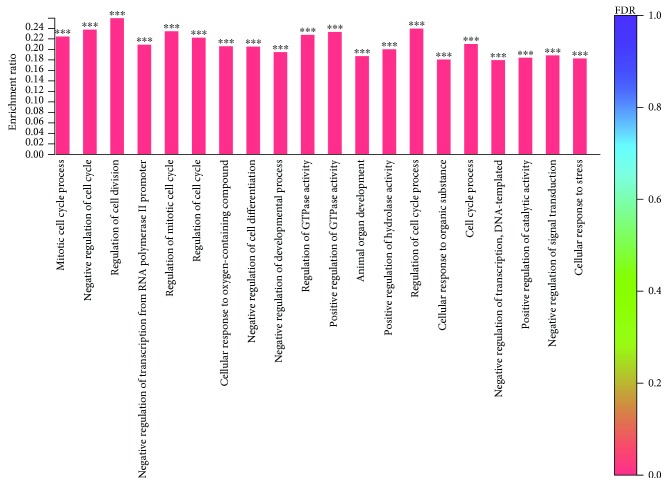
Figure 11.
Histogram of the Gene Ontology (GO) enrichment annotation of the differentially expressed genes between the torularhodin intervention and injury groups. FDR indicates the degree of GO enrichment; the darker the color, the more significant the effect of the GO gene. (∗∗∗ represents P < 0.001).

