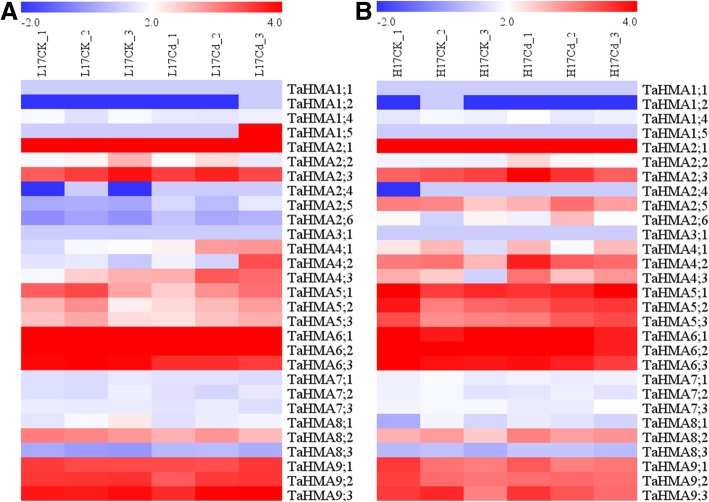
Fig. 8.
Heat map of the expression profiles of TaHMA genes under Cd treatment. a Expression profiles of TaHMA genes in L17Cd and L17CK groups. b Expression profiles of TaHMA genes in H17Cd and H17CK groups. Log2 transformed FPKM values were used to create the heat map. Red or blue indicates higher or lower relative abundance, respectively

