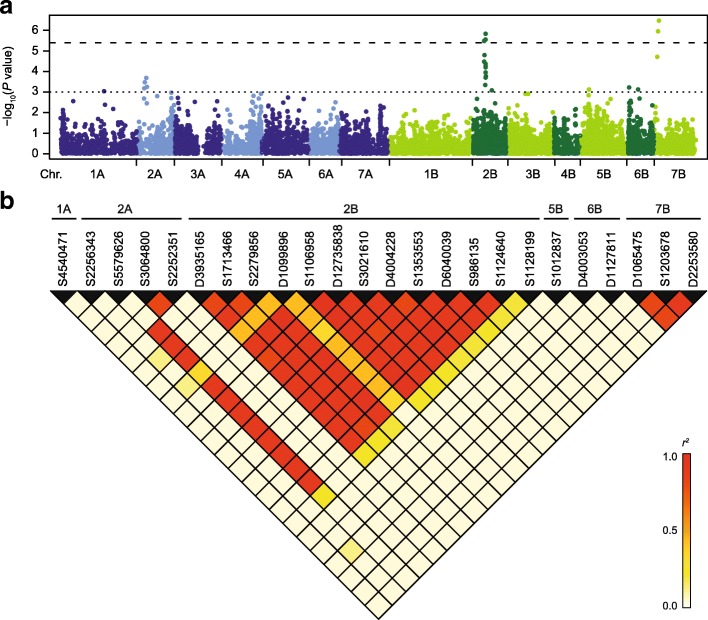
Fig. 1.
Identification of heading time QTL in durum wheat. a Manhattan plot showing results from the genome-wide scan for marker-trait associations for heading time. The dashed line indicates the significance threshold (Bonferroni-corrected P < 0.01) and the dotted line the exploratory threshold (P < 0.001). b Linkage disequilibrium between the significantly associated markers

