Fig. 2.
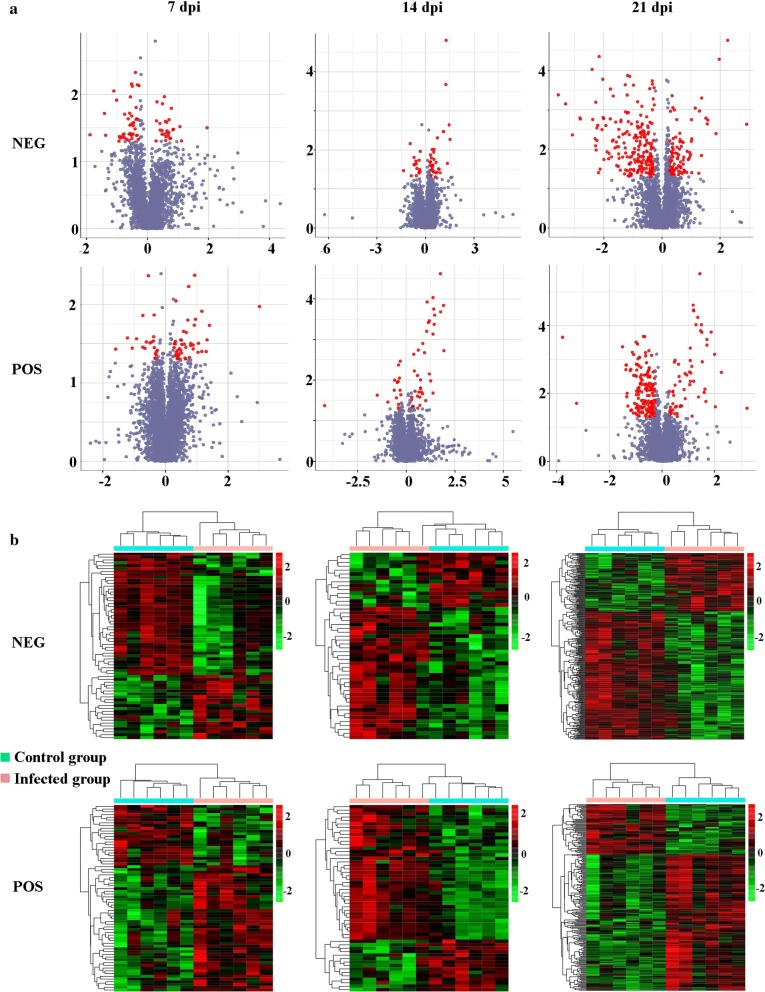
Metabolic differences in infected cerebral cortices at 7, 14 and 21 dpi. a Volcano plots of the differentially abundant metabolites. The log2 fold change is shown on the x-axis. Statistical significance displayed by − log10 (P-value) is shown from 0 to 4 on the y-axis. Metabolites having a fold change of > 1.5 and P < 0.05 (Student’s t-test) are represented by red dots. Metabolites that were not significantly changed are denoted by blue dots. Fold changes of the infected samples relative to the untreated control are based on the mean values of six biological replicates per group. b Heatmaps showing significantly dysregulated metabolites in the mouse cerebral cortex. Upregulated (red) or downregulated (green) metabolites (fold change > 1.5; P < 0.5) are indicated. POS and NEG indicate positive ion mode and negative ion mode, respectively

