Fig. 3.
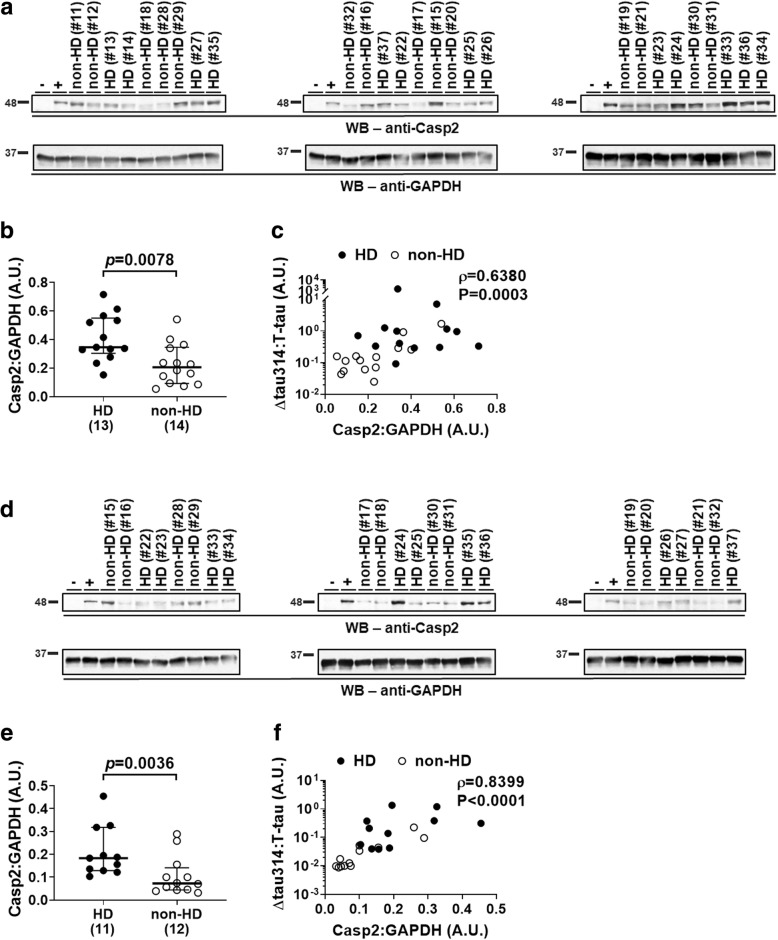
Levels of Casp2 are higher in HD patients of the large cohort. a, d Representative WB showing that Casp2 (~ 48-kDa full-length form, upper panels) and GAPDH (loading control, lower panels; revealed in the same blots as Casp2) were detected in the prefrontal cortex (Brodmann’s area (BA) 8/9) of subjects from the NIH NeuroBioBank and the New York Brain Bank (a), and in the caudate nucleus of subjects from the NIH NeuroBioBank (d). HD, Huntington’s disease patients; non-HD, individuals without Huntington’s disease. -, Casp2 knock-out FVB/129S6 mice (negative control); +, wild-type non-transgenic FVB/129S6 mice (positive control). Sample IDs and disease diagnoses (Additional file 1: Table S1) were shown. b, e Comparison of levels of Casp2 in the prefrontal cortex (BA 8/9) of HD patients and non-HD individuals from the NIH NeuroBioBank and the New York Brain Bank (b), and in the caudate nucleus, from the NIH NeuroBioBank (e). The numbers of analyzed subjects are shown in parentheses. Mann-Whitney test was used for between-group comparison; medians (middle long bars), and 1st (lower short bars) and 3rd (upper short bars) quartiles are shown. c, f Correlation of levels of Casp2 (normalized to the house-keeping protein GAPDH) and levels of Δtau314 proteins (normalized to levels of T-tau proteins) in the prefrontal cortex (BA 8/9) of HD patients and non-HD individuals from the NIH NeuroBioBank and the New York Brain Bank (c), and in the caudate nucleus, from the NIH NeuroBioBank (f). Spearman’s rank-order correlation was used. The y-axes in figures c and f are in log scale. A.U. = arbitrary unit

