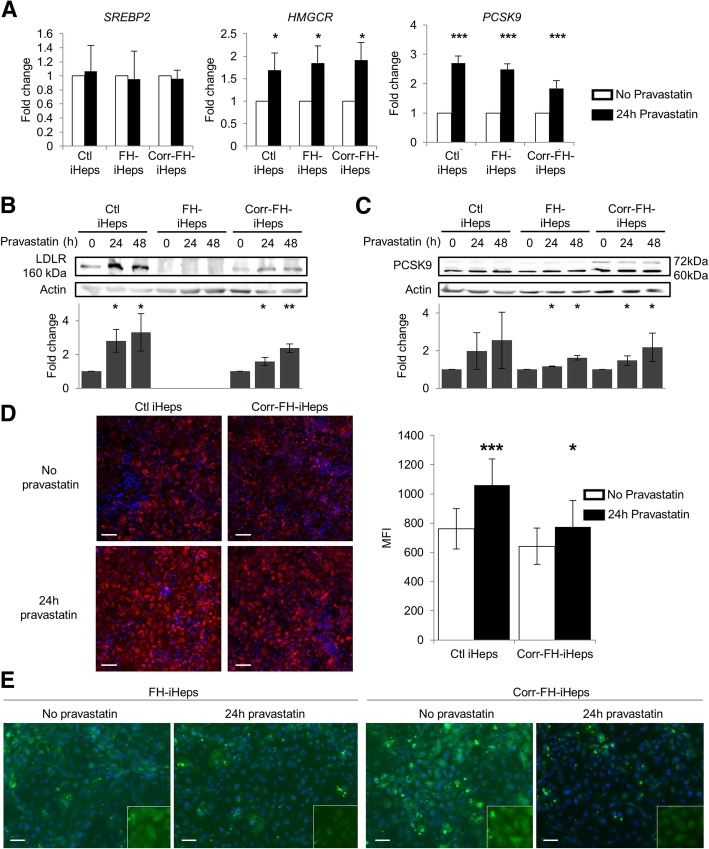
Fig. 5.
Effect of pravastatin on the regulation of target genes involved in cholesterol metabolism. a Quantitative reverse-transcription PCR (qRT-PCR) analyses of the expression of SREBP2, HMGCR and PCSK9 24 h after induction with 10 μM of pravastatin. Results are expressed relatively to untreated samples as mean ± SEM (n = 3). Statistical significance was determined by Student’s test, *P < 0.05, ***P < 0.001. b, c Western blot analyses of the expression of LDLR (b) and PCSK9 (c) in iHeps treated or not with pravastatin for 24 h or 48 h. The LDLR and PCSK9 bands were quantified with the ImageJ software with normalization by signals of β-actin. Results are expressed relatively to untreated samples as mean ± SEM (n = 3). Statistical significance was determined by Student’s test, *P < 0.05, **P < 0.01. d Representative confocal images of Dil-LDL internalization in Ctl- and corr-FH-iHeps treated or not with pravastatin for 24 h. Nuclei were counterstained with DAPI. Scale bars: 100 μm. FACS analysis of internalized Dil-LDL levels: results are expressed as mean fluorescence intensity (MFI) relative to untreated samples (n = 3). e Immunofluorescence staining for SREBP2 in FH-iHeps and in corr-FH-Heps treated or not with pravastatin for 24 h, showing SREBP2 translocation into the nuclei after pravastatin treatment. Nuclei were counterstained with DAPI. Scale bars: 50 μm

