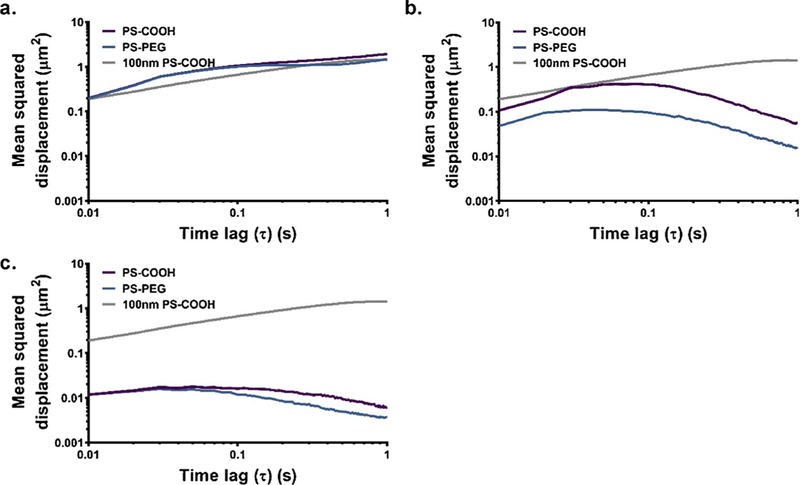
Fig. 5.

MSD profiles of PS-COOH and PS-PEG nanoparticle samples of varying average particle sizes to mimic nanoparticles in various stages of aggregation. This includes (a) equal mass fractions of 100, 200, 500, 1000, and 2000 nm PS-COOH (purple) or PS-PEG NPs (blue) in ACSF without calcium chloride, (b) equal particle concentrations of 100, 200, 500, 1000, and 2000 nm PS-COOH or PS-PEG NPs in ACSF without calcium chloride, and (c) 2000 nm PS-COOH or PS-PEG NPs in ACSF without calcium chloride. Data represent the precision-weighted geometric MSD averages over videos per well (n = 5) and wells per condition (n = 4). Error bars at τ = 0.1, 0.5, and 1 s represent 95% CIs. MSD values of 100 nm PS-COOH NPs (grey) in similar conditions is provided as a reference in all plots. (For interpretation of the references to color in this figure legend, the reader is referred to the web version of this article.)
