
Figure 1.
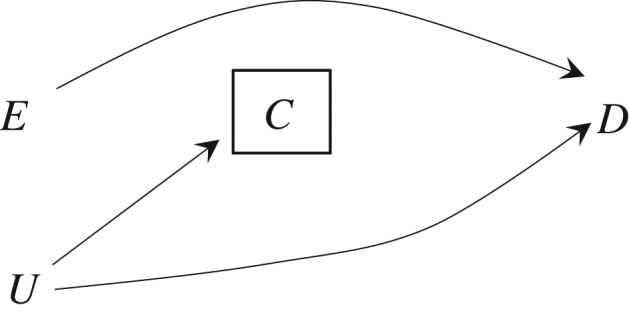
Causal directed acyclic graph off the null where E is exposure, D is disease, C is censoring, and U is the unmeasured common causes of C and D. The box around C indicates that the analysis is conditional on being uncensored.
Official websites use .gov
A
.gov website belongs to an official
government organization in the United States.
Secure .gov websites use HTTPS
A lock (
) or https:// means you've safely
connected to the .gov website. Share sensitive
information only on official, secure websites.
Causal directed acyclic graph off the null where E is exposure, D is disease, C is censoring, and U is the unmeasured common causes of C and D. The box around C indicates that the analysis is conditional on being uncensored.