
Fig. 5. Clinical relevance for GPNMB.
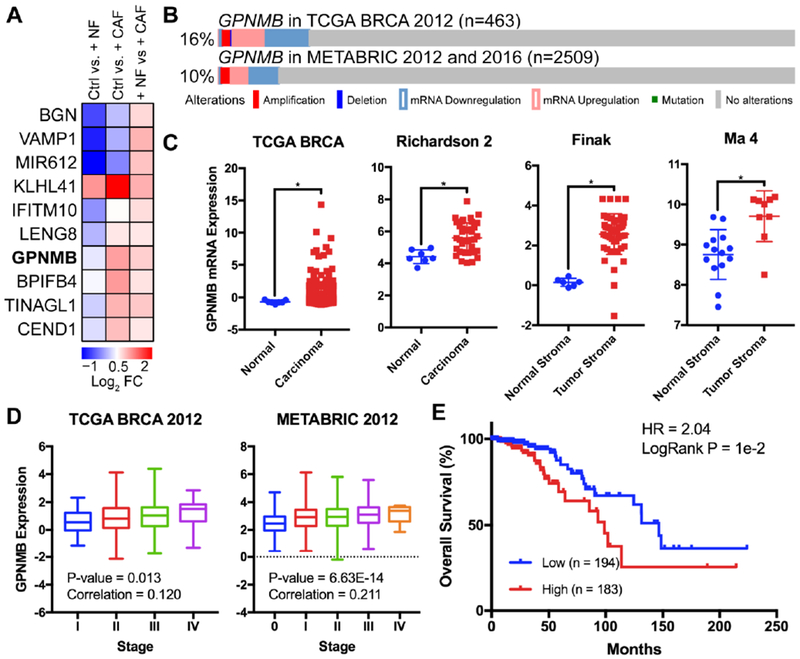
(A) Heat map of top 10 DEGs when comparing NF and CAF co-cultures. (B) Incidence of GPNMB alterations in two different cohorts from public datasets[23–27]. (C) GPNMB expression from TCGA-BRCA in breast cancer compared to normal. * denotes significant difference for p < 0.05; unpaired t-test[28–30]. (D) GPNMB expression positively correlated with tumor stage[24, 27]. (E) Kaplan–Meier analysis of overall survival from TCGA-BRCA data sets. HR, 2.04; P = 1e-2. High expression of GPNMB was correlated to poorer patient prognosis using TCGA data [24].