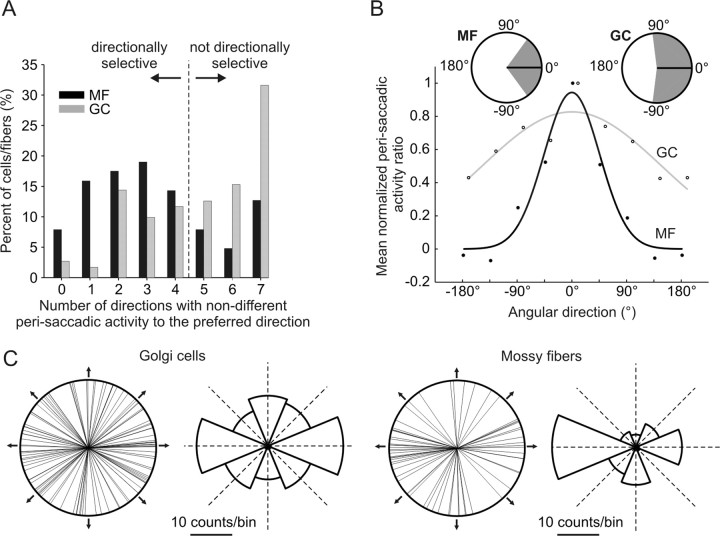
Figure 6.
Directional selectivity properties of GC and MF. A, Histogram showing the percentage of cells/fibers considered to be directionally selective. Only units in which mean perisaccadic activities in the preferred direction of movement were not significantly different from the mean in four or less neighboring directions were considered to be directionally selective. B, Gaussian fits to the mean normalized perisaccadic activity ratio points (see Materials and Methods) of the eight tested directions of 111 and 63 Golgi cells (empty circles) and mossy fibers (filled circles) respectively, aligned to the direction where their mean perisaccadic activity is maximal. Insets, The SD (shaded area) around the preferred direction of the average cell/fiber. C, Circular plots showing the preferred directions of 97 Golgi cells and 61 mossy fibers (only units with appropriate Gaussian fits to the directional data points were included, see Materials and Methods), together with histograms in which these directions were binned into octants. The arrows and dotted lines designate movement directions.

