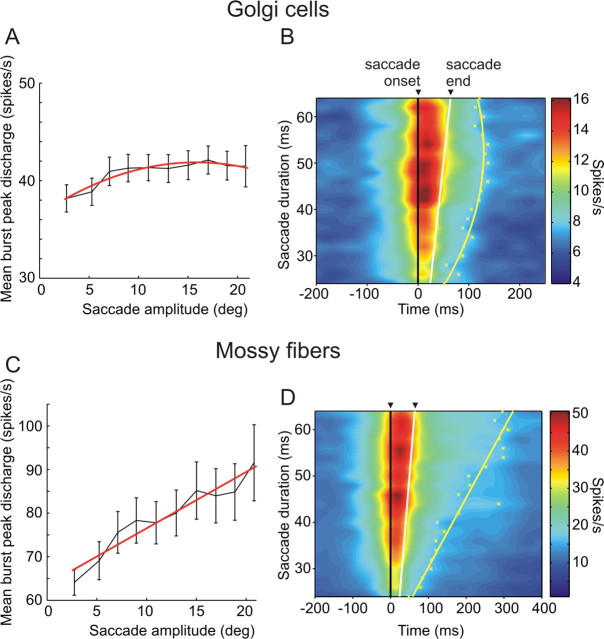
Figure 8.
Amplitude tuning properties of the average peak discharge of Golgi cell and mossy fiber bursting units (A, C) and timing properties of the mossy fiber and Golgi cell population responses. A, Mean burst peak discharge as a function of saccade amplitude calculated for 105 Golgi cells. The delimiters indicate SEs, and the red line is a quadratic least squares fit to the data points. B, Population response of 177 Golgi cells. Yellow crosses indicate the estimation of the burst end for each duration bin, and the yellow line is a least squares quadratic fit to those points. C, Same data as in A but for 86 mossy fibers fitted with a linear function. D, Same data as in B but for 103 mossy fibers with the yellow line being a linear least squares fit.

