
Figure 6.
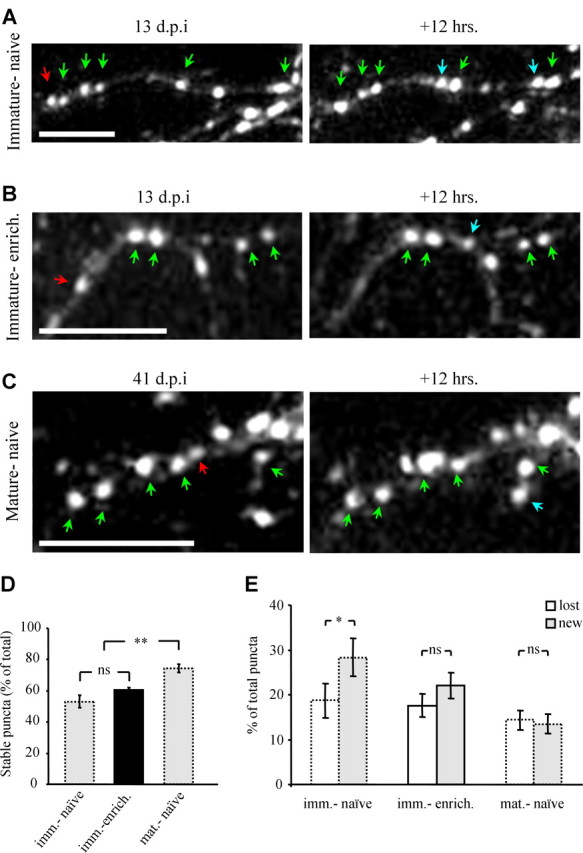
Dynamics of odor-enriched adult-born PGNs compared with immature and mature adult-born PGNs. A–C, Images of PSD95-GFP puncta from 12 h time-lapse sequences, in vivo. Immature PGN from a naive mouse (A), an immature PGN from an enriched domain (B), and a mature PGN from a naive mouse (C). Examples of stable, lost, and new puncta are marked with green, red and blue arrows, respectively. D, Bar graphs showing the levels of stable puncta which is higher in mature PGNs. E, Bar graphs of puncta dynamics. In contrast to immature PGNs from naive mice, mature PGNs and immature PGNs from enriched domains had similar values of new and lost puncta. n = 5 immature PGNs from enriched domains, from 3 mice. All values are mean ± SEM, *p < 0.04, **p < 0.003 (Kruskal–Wallis test and Mann–Whitney test). Note that data of puncta dynamics of immature and mature neurons from naive mice is the same as in Figure 4 (dotted bars). Scale bars, 10 μm. Imm.-naive, Immature PGNs from naive mice; mat.-naive, mature PGNs from naive mice; imm.-enrich., immature PGNs from enriched domains in enriched mice.