
Figure 1.
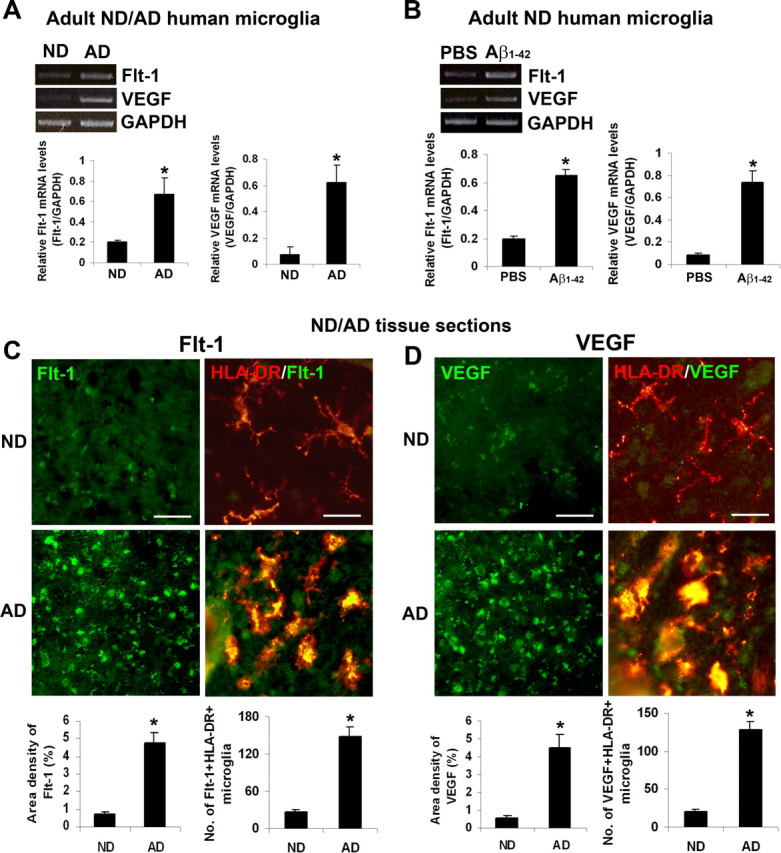
Expression of Flt-1 and VEGF in human ND/AD microglia and in ND/AD tissue. A, Typical RT-PCR for Flt-1 and VEGF expressions in microglia obtained from ND and AD brain tissue. The bar graphs show semiquantitative results for relative levels of mRNA for Flt-1 and VEGF from 8 ND and 6 AD individuals. *p < 0.05. B, Representative expressions of Flt-1 and VEGF in human ND microglia treated with PBS or Aβ1–42 (5 μm for 8 h). The bar graph presents overall semiquantitative results for the two factors (n = 4 independent samples/group) *p < 0.05. C, Marker immunoreactivities (ir) from ND tissue and AD tissue showing representative single staining for Flt-1 and double staining of Flt-1/HLA-DR. Areas of merged double staining are yellow. Scale bar: 150 μm (left panels) and 50 μm (right panels). Overall ir (n = 6 cases from ND, 7 cases from AD) for Flt-1 and numbers of Flt-1(+) microglia. D, Representative results showing single staining for VEGF and double staining for VEGF/HLA-DR in ND and AD tissue. Scale bar: 150 μm (left panels) and 50 μm (right panels). Quantification (n = 6 cases from ND, 7 cases from AD) of VEGF ir and numbers of VEGF(+) microglia. *p < 0.05.