
Figure 3.
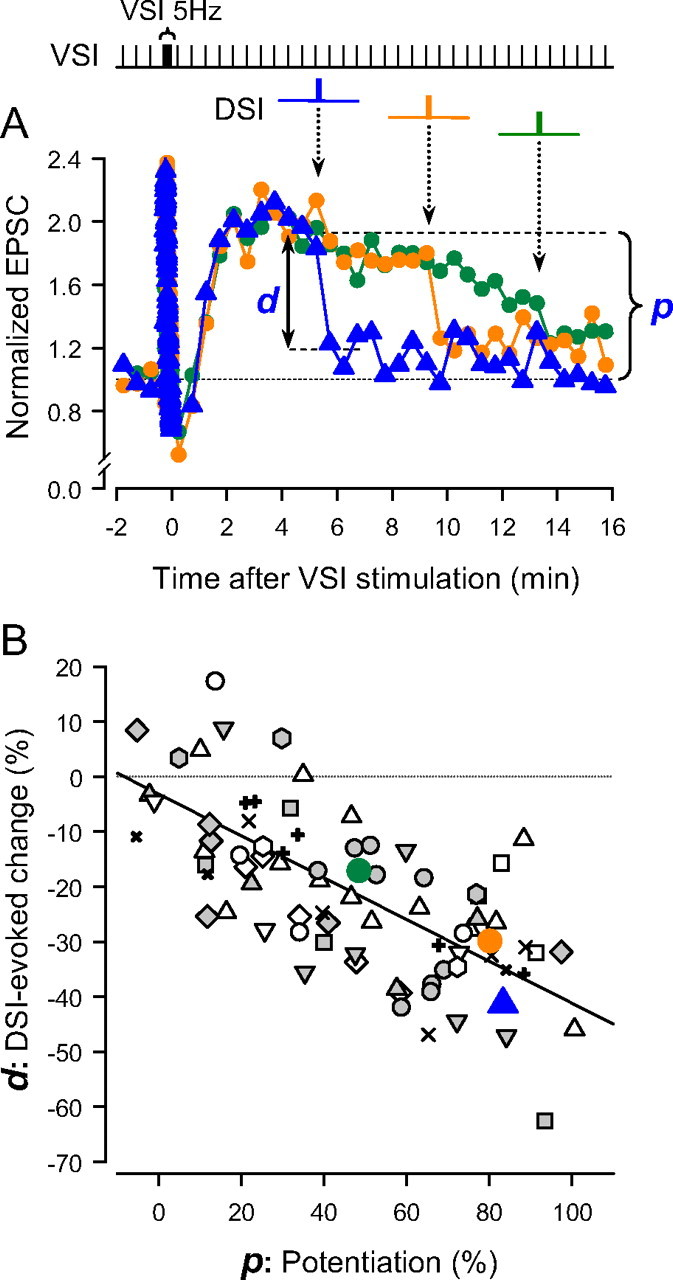
The extent of DSI-evoked decrement is dependent on the magnitude of the potentiation. A, Overlaid plots of the normalized EPSCs against time (seconds). Time 0 is set as the time of the last action potential in the VSI spike train (5 Hz, 15 s). In each plot, a DSI spike train was stimulated at three different times with respect to the end of the VSI train (blue, 315 s; orange, 555 s; green, 795 s). The amplitudes were normalized to the average of 3 EPSCs before the VSI tetanus. The bracket and the arrow indicate the extent of potentiation (p) at the time of DSI stimulation and decrement (d) produced by DSI for the trial indicated in blue. B, The extent of DSI-evoked decrement is correlated to the amount of the potentiation state (R2 = 0.47). The DSI-evoked decrement (%) was plotted as a function of the magnitude of potentiation (%). The p values were shown as a percentage change from the basal EPSC amplitude, whereas the d values as a percentage change from the potentiated EPSC amplitude (see Materials and Methods for details). Data from 15 preparations are plotted; each symbol represents data from a single preparation. There was a negative-slope, linear relationship between the extent of the decrement and the degree of potentiation (R2 = 0.47, F(1,76) = 59.4, p < 0.001 by ANOVA).