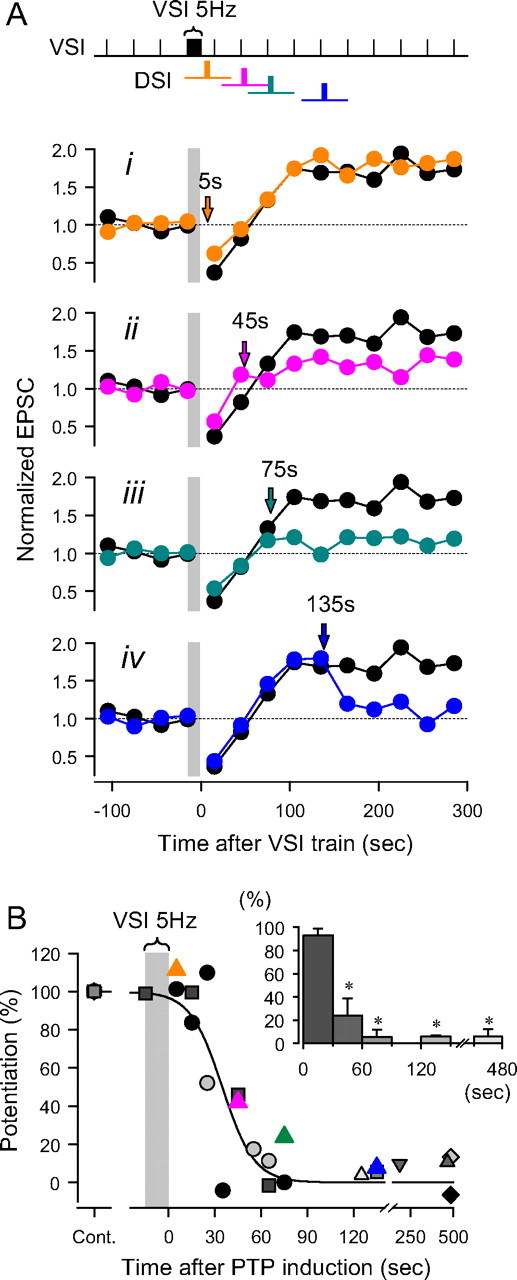
Figure 7.

Timing dependence of DSI-evoked depotentiation of VSI synaptic strength. A, The time of DSI stimulation was varied with respect to the end of the VSI spike train. For comparison a control trial is shown in which DSI was not stimulated (black circles). i, At 5 s after the VSI tetanus, DSI had little effect on potentiation. ii, At 45 s, DSI partially reduced the magnitude of the potentiation. iii, After 75 s, DSI stimulation almost completely reduced the magnitude of potentiation. iv, At 135 s, the potentiation was already maximum and DSI stimulation caused depotentiation. EPSC amplitudes during the VSI 5 Hz spike train are omitted and shown by a gray bar. B, Results from nine preparations show the time course over which DSI stimulation becomes effective at depotentiating the synapse. The extent of potentiation after a DSI spike train is shown as percentage of the amplitude of the control potentiation without DSI stimulation, and is plotted against the time of DSI stimulation. DSI stimulation must follow the VSI spike train by at least 60 s to be maximally effective at depotentiation. The plot was fit by a sigmoidal curve, f(t) = a/(1 + exp(−(t − t0)/b)), where t is the time after the end of VSI spike train, a = 1, b = −10.4, t0 = 34.8 (R2 = 0.82). Inset, A bar graph showing the extent of potentiation binned in 30 s intervals after a VSI spike train (5 Hz). Each bar shows mean ± SEM. Asterisks indicate significant difference in the magnitude of potentiation with respect to the data at 0–30 s (F(4,10) = 21.8, p < 0.001 by one-way ANOVA with pairwise multiple comparison by Student–Newman–Keuls method).
