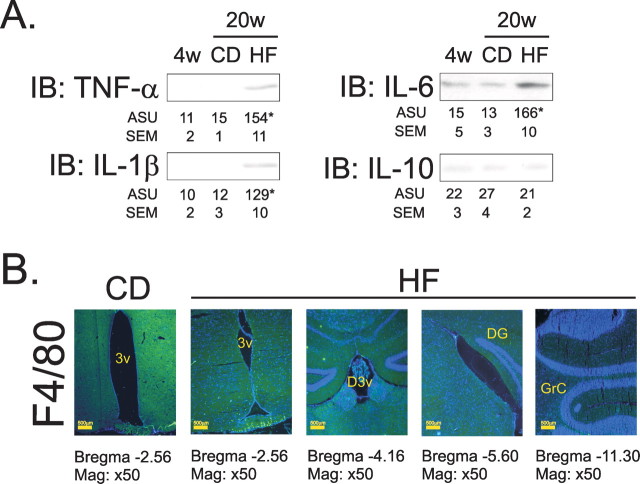
Figure 1.
A, Immunoblot (IB) analysis of expression of TNF-α, IL-1β, IL-6, and IL-10 in hypothalamic protein extracts obtained from 4 (4 w)- and 20 (20 w)-week old rats fed on CD and HF diets for 16 weeks, starting at 4 weeks of age. B, Immunofluorescence staining of F4/80 in the CNS of rats fed on CD and HF diets for 16 weeks; representative microphotographs were obtained from hypothalamic periventricular (3v) zone, in the first and second panels from the left; dorsal third ventricular (D3v) zone, in the third panel from the left; dentate gyrus zone (DG), in the fourth panel from the left; and granular layer of cerebellum, in the fifth panel from the left. In A, n = 5; results are presented as arbitrary scanning units (ASU) ±SEM, *p < 0.05 versus respective control. B, Microphotographs are representative of three distinct experiments; nuclei are stained with DAPI.

