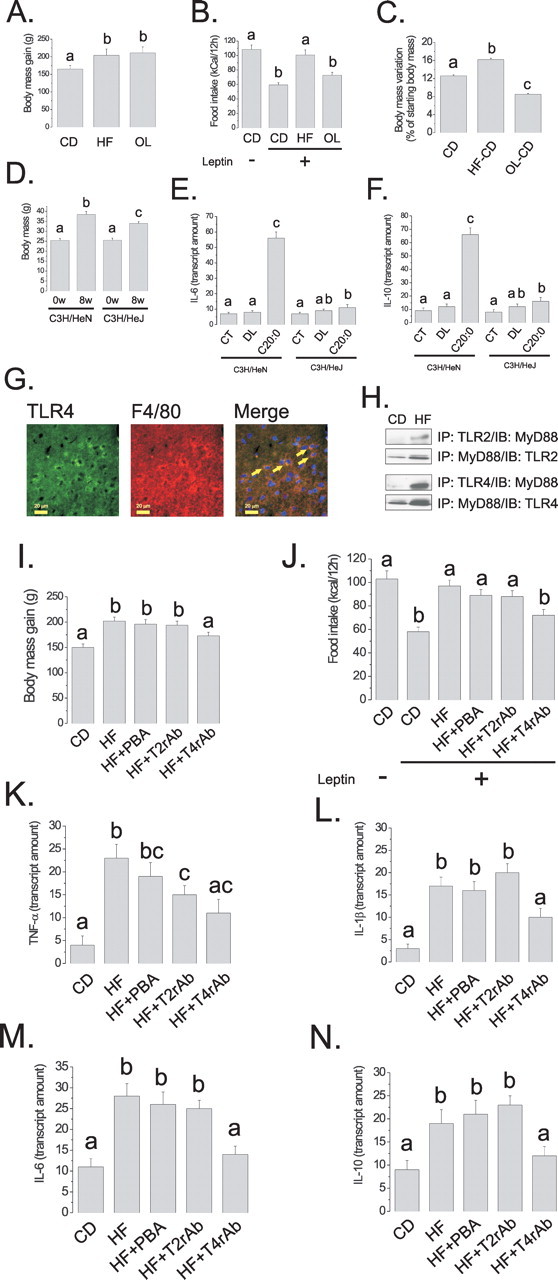
Figure 8.

A–C, Rats were fed on CD, HF, or OL diets for 8 weeks; body mass variation (A) was determined during the experimental period. At the end of the experimental period, rats were treated intraperitoneally with saline (100 μl) (−) or a similar volume of leptin (10−6 m) (+), and spontaneous food intake was determined over 12 h (B). After 8 weeks on either diet, HF and OL rats were reallocated to CD diet for a further 4 weeks, and body mass variation was determined (C). D, C3H/HeN and C3H/HeJ mice were fed on a saturated-rich high-fat diet for 8 weeks, and body mass was determined in the first (0w) and last days (8w) of the experimental periods. E, F, Real-time PCR determination of IL-6 (E) and IL-10 (F) mRNA expressions in hypothalamic samples obtained from C3H/HeN and C3H/HeJ mice nonintracerebroventricularly canullated (CT), or treated intracerebroventricularly with diluent (DL) or arachidic acid (C20:0). G, Double-immunofluorescence staining of TLR4 and F4/80 in the arcuate nucleus of rats fed on high-fat diet for 8 weeks, the arrows depict double-positive cells. H, Immunoprecipitation (IP) analysis of the associations of TLR2 and TLR4 with MyD88 in hypothalamic protein extracts obtained from rats fed on CD or HF diets for 8 weeks. I, J, Rats were fed on CD or HF diets for 8 weeks. Throughout the period, the rats were treated with a daily intraperitoneal dose of PBA (HF+PBA), TLR2-inhibiting antibody (HF+T2rAb), or TLR4-inhibiting antibody (HF+T4rAb). Body mass variation (I) was determined. At the end of the experimental period, rats were treated intraperitoneally with saline (100 μl) (−) or a similar volume of leptin (10−6 m) (+), and spontaneous food intake was determined over 12 h (J). K–N, Real-time PCR determination of TNF-α (K), IL-1β (L), IL-6 (M) and IL-10 (N) mRNA expressions in hypothalamic samples obtained from rats treated according to the same protocol as for I, J. In all experiments, except G, n = 5; different letters mean significant differences between groups, p < 0.05. G, Microphotographs are representative of three distinct experiments; nuclei are stained with DAPI. The depicted blots are representative of five distinct experiments.
