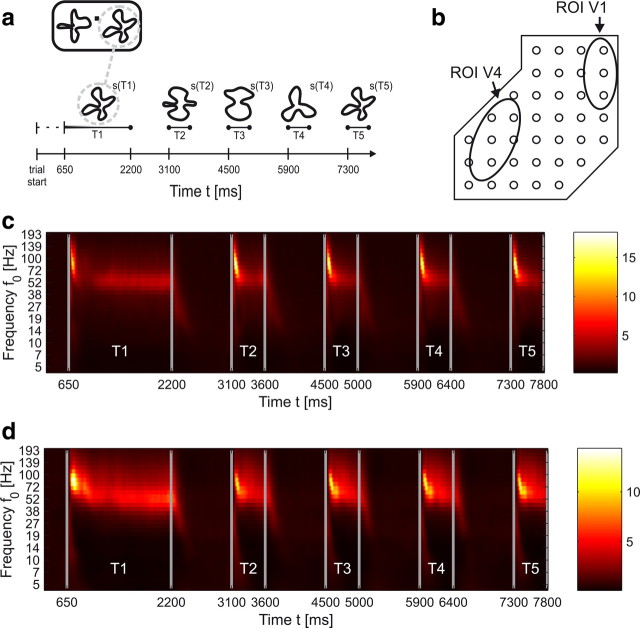
Figure 1.
a, Schematic illustration of the shape-tracking task. Two sequences of static shapes were presented in the left and right hemifield of a computer screen (upper left rectangle). While the monkey was fixating on a dot in the center of the screen, attention of the monkey was directed by a 200 ms green coloring fading out within further 400 ms to one of the initial shapes presented during period T1—in this example, to the right-hand shape. The task for the animal was to signal the reoccurrence of the initial shape in the attended hemifield during one of the following periods T3–T5. Here, a correct response would be during or after presentation of shape s(T5). b, Regions of interest in V1 and V4 where the stimuli caused substantial activation (see Materials and Methods). c, d, Examples for typical time–frequency plots on the same time axis as in a, displaying the trial-averaged, normalized power spectral density A(t, f0) in the attended condition for an electrode over V1 (c) and over V4 (d) from monkey F.

