Figure 2.
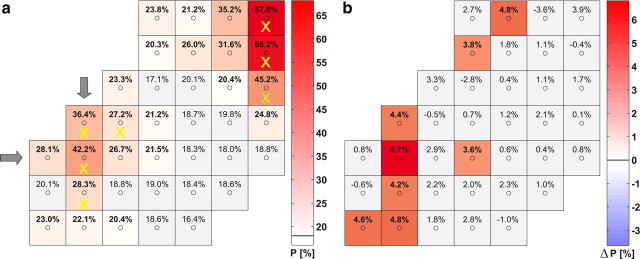
a, Classification performance P of the initial shape s(T1) (presented from t = 650 ms to t = 2200 ms, cf. Fig. 1a) for monkey F in the attended condition. P is shown in dependence on the position of the electrodes in the array (small circles). The performance level is color coded according to the bar shown to the right of the array. For the gray colored squares, classification performance did not differ significantly (p = 0.02) from the chance level of 18% (indicated by the black horizontal line in the color bar). Classification performance reaches peak values of 67.8% (NFreq = 17; NElec = 1; pChance < 1 × 10−325) and 42.4% (NFreq = 17; NElec = 1; pChance < 2 × 10−96) in two regions corresponding to areas V1 and V4, respectively (cf. Fig. 1b). Gray arrows mark the “main” V4 electrode showing the highest performance. The combinations of electrodes in V4 selected for our further computational analysis are marked with yellow crosses (V1, green crosses). b, Difference in classification performance between attended and nonattended stimuli, same display as in a. The gray squares indicate electrodes where either the differences in performance deviated not significantly from zero, or where the performance under attention was not significantly different from chance level (p = 0.02).

